
Election 2020: What about the other states?
Election 2020: What about the other states?
Comparative analysis shows that many states were injured by the bad actor states...

Summary: Comparative analysis of the remaining states shows an almost boring regularity to their vote tabulation efforts. While there are a few exceptions with audit transactions (this study clearly shows that audit transactions are a thing with state election officials - just not enormously huge transactions in the middle of tabulation as is true of three of the states we’ve already analyzed - only New York being a near exception in this study), for the most part these 41 states exhibited regular patterns of proportional tabulations that should be the envy of the world.
Conclusions: I’ll place my conclusions here, since I know many will not have the time to read all the support herein.
I’m pleased that Texas has stolen the thunder of the message I wanted to convey as the result of completing this analysis. It’s clear that most of the 41 states evaluated here conducted fair elections and did their tabulations with focus and discipline. But what is the use of making such a strenuous effort at fairness if a few states - in some cases through the actions of election officials (or persons impersonating them with their level of election security access) and in some cases by presiding over extremely unlikely single tabulation events comparatively - run roughshod over the sacred franchise of the vote? If another state does not show a keen interest in preventing voter fraud, or if it appears that a state is overtly participating in election fraud itself at the most trusted level of election security, what injury does it cause the other states? Total. As Texas argues, the electoral process is a zero sum game. Further, independently of the other electoral and due process arguments Texas makes, they state:
…even the appearance of fraud in a close election is poisonous to democratic principles: “Voters who fear their legitimate votes will be outweighed by fraudulent ones will feel disenfranchised.” Purcell v. Gonzalez, 549 U.S. 1, 4 (2006); Crawford v. Marion County Election Bd., 553 U.S. 181, 189 (2008) (States have an interest in preventing voter fraud and ensuring voter confidence).
Leaving behind all of the specific arguments about constitutionality, due process, and equal protection (without discounting their importance), I want to focus on “appearance”. Appearance is something that can be represented graphically. Look at the graphical representations of the tabulations of the nine states in my previous post. Look at the 41 graphical representations of the tabulations in this post. Which ones portray impossible negative vote tabulations in the midst of counting the votes? Which portray huge non-proportional single tabulations? Which ones portray extreme time delay between early tabulation efforts?
I acknowledge that there is a spectrum among the nine states that affirmatively answer those questions. I look at Arizona and conclude - it looks mostly fair. There are troubling time delays. But it also looks too close to call. It deserves some further evaluation. On the other hand, I look at Pennsylvania and Virginia and see the apparent contempt and callous view of the franchise - that voters are just so much victuals to be stirred in a pot of poisoned numbers - and I think that those actions disenfranchise us all.
It remains that there is an appearance of fraud in a number of states. That appearance disenfranchises tens of millions of voters in other states because it thwarts those states’ interests.
That alone, to me, is sufficient for many other states to join Texas in common interest, to wrest the country back from this pit of ugly fraud before us.
I urge you to contact the Attorney General of your state and urge them to join with Texas. Or file new suits in their own interests. The Republic may depend on it.
Now on to the other states. This may seem a bit daunting, but it’s instructive to see how the rest of the states performed their tabulation duties.
We previously looked at nine states. Among them, they exhibited a couple of patterns: 1) massive negative vote “tabulations” (actually audit transactions) during the early series of vote tabulations and 2) Large non-proportional tabulations occurring suddenly during later tabulation (or a hybrid of the two as in Minnesota) or 3) Long, unexplainable delays between tabulations. As we look at the remaining 41 states, my objective is to look at them like we are triers of fact. Often juries are asked to accept comparative analysis like this: “Are these fibers from the trunk like those that are from the home?”, “Are the markings on this bullet nearly identical to the ones fired from this gun?” That will be the focus of this analysis. All times are eastern time as posted in the Edison data.

Alabama seems to be a model state for vote tabulation. The vote frequency is a beautiful bell curve and it’s centered almost at the middle of the tabulation. The vote tabulation has almost no tail - that means a focused, highly disciplined tabulation effort. By November 10th, it’s last tabulation was on November 6th. The count delays were at the end of tabulation.
There’s no apparent mail-in / absentee ballot spike at the beginning of the tabulation.
All tabulation updates appear to feature proportionality between the candidates.
Alabama had an audit transaction at the 99th percentile that deducted a total of 408 votes, 106 plus in favor of Biden.
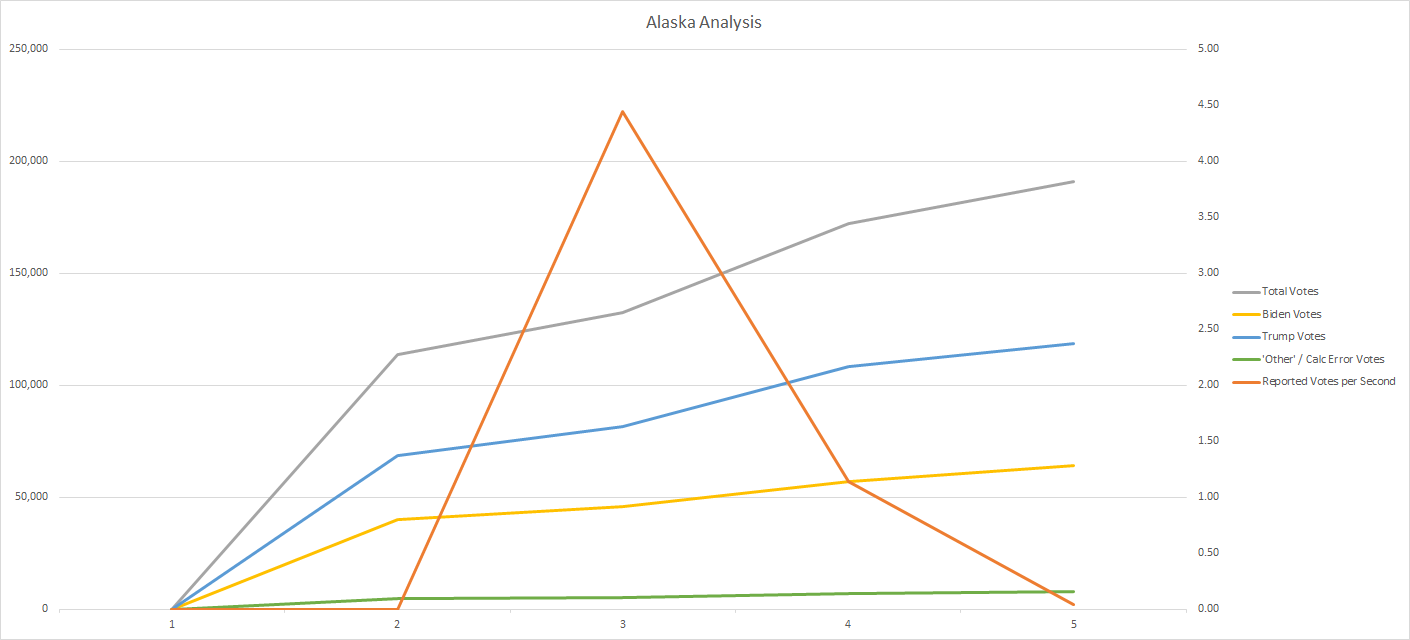
The area of Alaska is a bit more than 20% of the total area of the lower 48 states. It’s relatively sparsely populated and there’s limited transportation across the state.
Alaska had made 4 tabulations by November 10th at the 61st percentile. Its fastest count rate was 4.5 ballots per second (compared with 30,000 per second or so in bursts for some states). It appears that they are able to count just the more populated areas in this generous period of time. Undoubtedly, they must employ bush planes for some of the outlying population. Not sure about dog sleds.
The limited tabulation count appears to be proportional between the candidates.
Alaska had no audit transactions to November 10th.
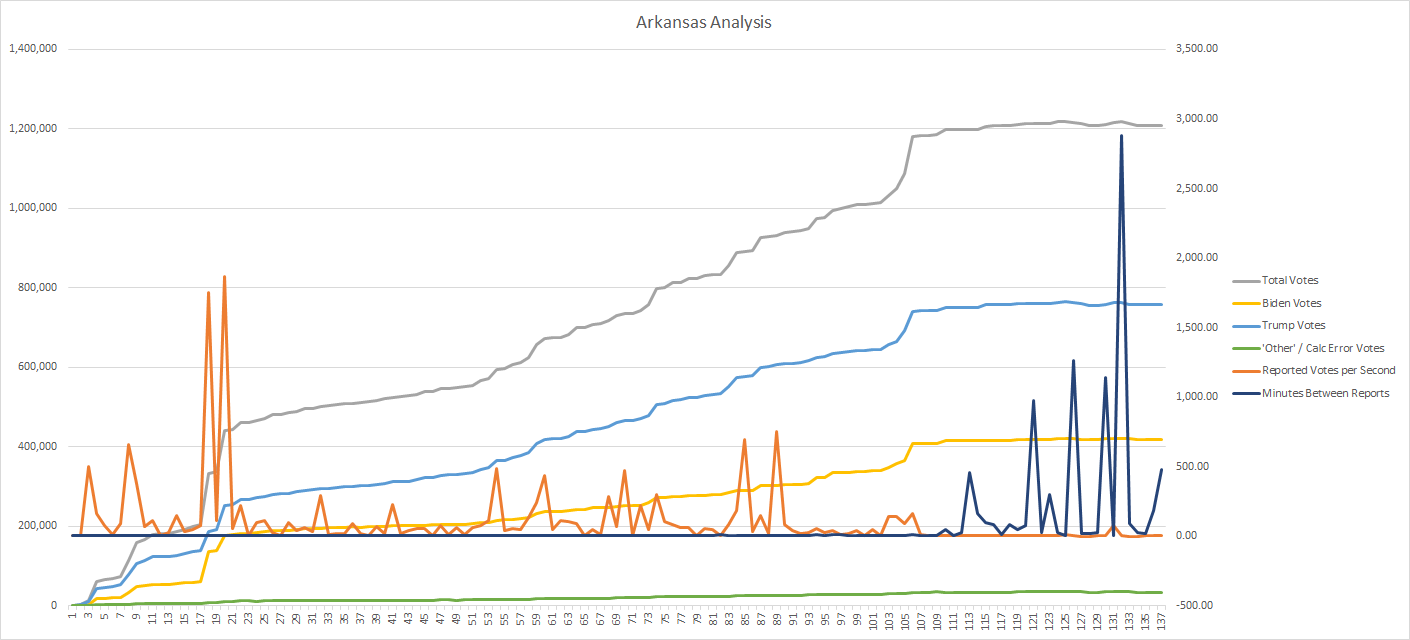
Arkansas featured a fair spike around the 17th to 21st tabulations that saw the vote move from the 15th percentile to the 36th percentile at a moderate counting rate. Visually, we can’t really make a determination whether this was counting mail-in / absentee ballots or not. There was constant counting for most of the period.
There were significant delays near the end of tabulation but above the 90th percentile.
All of the tabulations appear to feature proportionality between the candidates.
Arkansas appeared to commit 5 audit transactions at the 99th percentile, but four of those appear to be duplicates - offset by a couple of positive audit transactions affecting a net of around 2,700 votes positive in Biden’s favor.

California is marked by apparent mail-in / absentee ballot tabulation at a high count rate during the early tabulations.
The count appeared to progress expeditiously to about the 60th percentile - by about 5 AM on the morning after the election. Then the count seemed to move to rather lackadaisical levels through the snapshot period to November 10th.
There was a large update after a more than 60 hour tabulation delay that moved the vote from the 77th percentile to the 87th percentile. That update added almost one million votes to the total. That large update featured proportionality between the candidates - and even though the tabulation was substantially in favor of Biden at about at 167% ratio, President Trump’s incremental increase was greater than 12.5% while Biden’s was almost 10.8%.
All of the tabulations appear to feature proportionality between the candidates.
By November 10th California had tabulated to the 89th percentile. I understand that they are still counting.
California committed one audit transaction a the 89th percentile affecting almost 11,000 votes (which falls within the 0.1% margin - but net reduces the count for both candidates so we know it’s a calculated audit transaction) with a net 3,429 votes in favor of President Trump.

Colorado is marked by significant spikes in count rate in the beginning tabulations reflecting significant mail-in / absentee votes.
By November 10th, Colorado had counted to the 96th tabulation percentile.
All tabulations appear to feature proportionality among the candidates. Colorado had an unusually high third party tabulation of more than 2.5%.
Colorado did not apparently commit any audit transactions.

After an incremental start, there were relatively large count rate tabulations in the early tabulations.
By November 10th, Connecticut had counted to the 98th tabulation percentile.
All tabulations appear to feature proportionality among the candidates.
Connecticut had a very small audit transaction at the 98th percentile that favored President Trump by 35 votes.

Delaware made 9 tabulations by November 10th and had counted to the 99th percentile at that point.
All tabulations appear to feature proportionality among the candidates.
It seems very little has been made that President Trump achieved almost 40% of the vote in Biden’s home state.
Delaware did not have any audit transactions posted by November 10th.
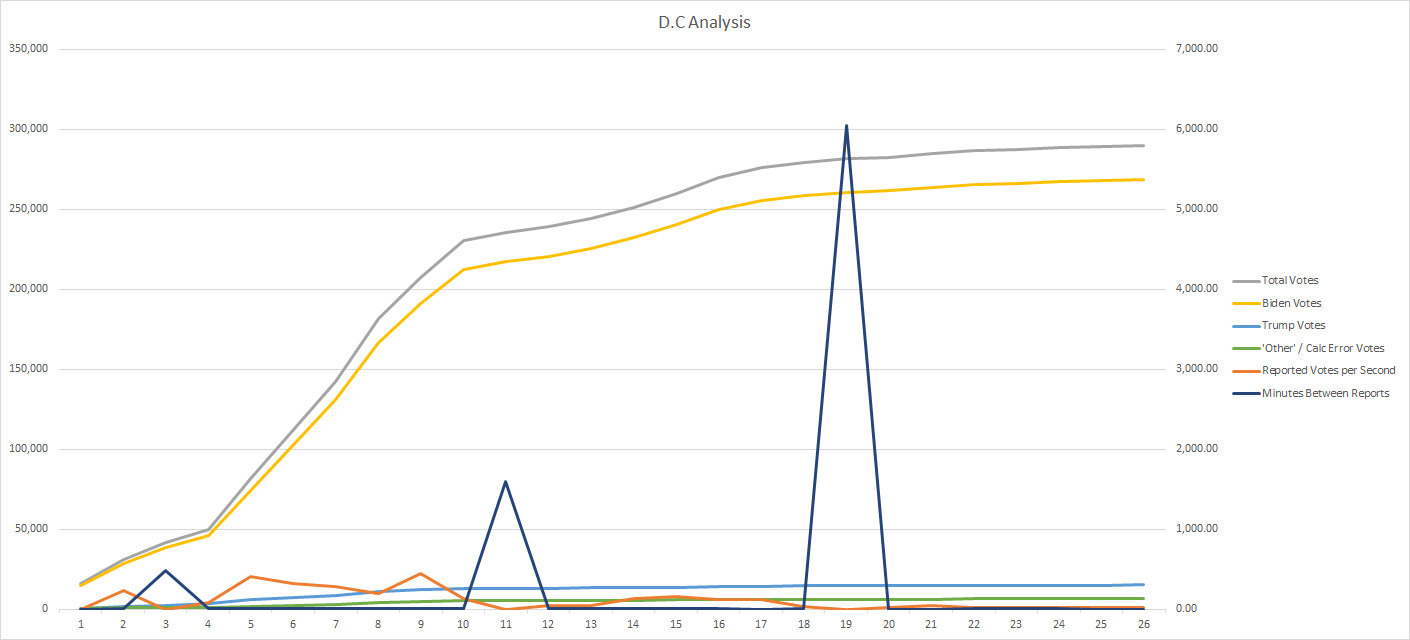
The District of Columbia made 26 tabulations by November 10th and had tabulated to the 83rd percentile by that time.
All tabulations appear to feature proportionality among the candidates, with more than 92% favoring Biden.
There were two significant delays in vote tabulation. One of almost 27 hours and one of almost 101 hours - this at the 80th percentile of the vote. They managed to count a little over 290,000 votes by November 10th.
They issued no apparent audit transactions by November 10th.
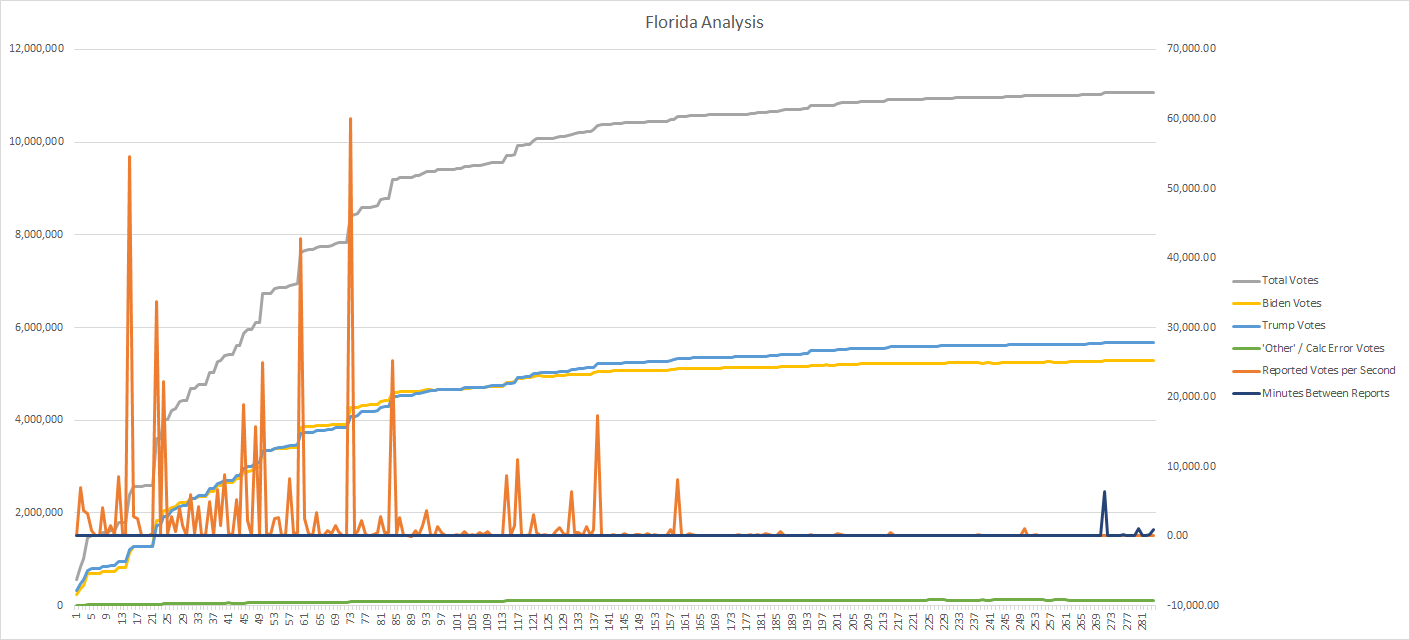
Florida featured early heavy vote tabulations rates. It’s possible that the two distinct surges reflect that there are two time zones across the state.
They tabulated over 11,000,000 votes by 6:10 AM on November 4th to the 99th percentile of the vote. There were 13 sporadic small tabulations in the following days adding about 3,000 votes to the November 4th total. (Whereas, its neighbor just to the north, Georgia, made 102 tabulation reports after it had reached the 99th percentile, adding about 35,000 votes to the total - an order of magnitude more than Florida did, with Florida having more than 220% more votes to tabulate.)
The tabulations appear to feature proportionality among the candidates, with a takeover of the lead by President Trump over a period of 39 tabulations starting at about the 80th percentile of the vote.
Florida is emblematic of a state that can count a large number of votes quickly.
Florida issued a single very small audit transaction as their last tabulation by November 10th that net favored Biden by 12 votes.
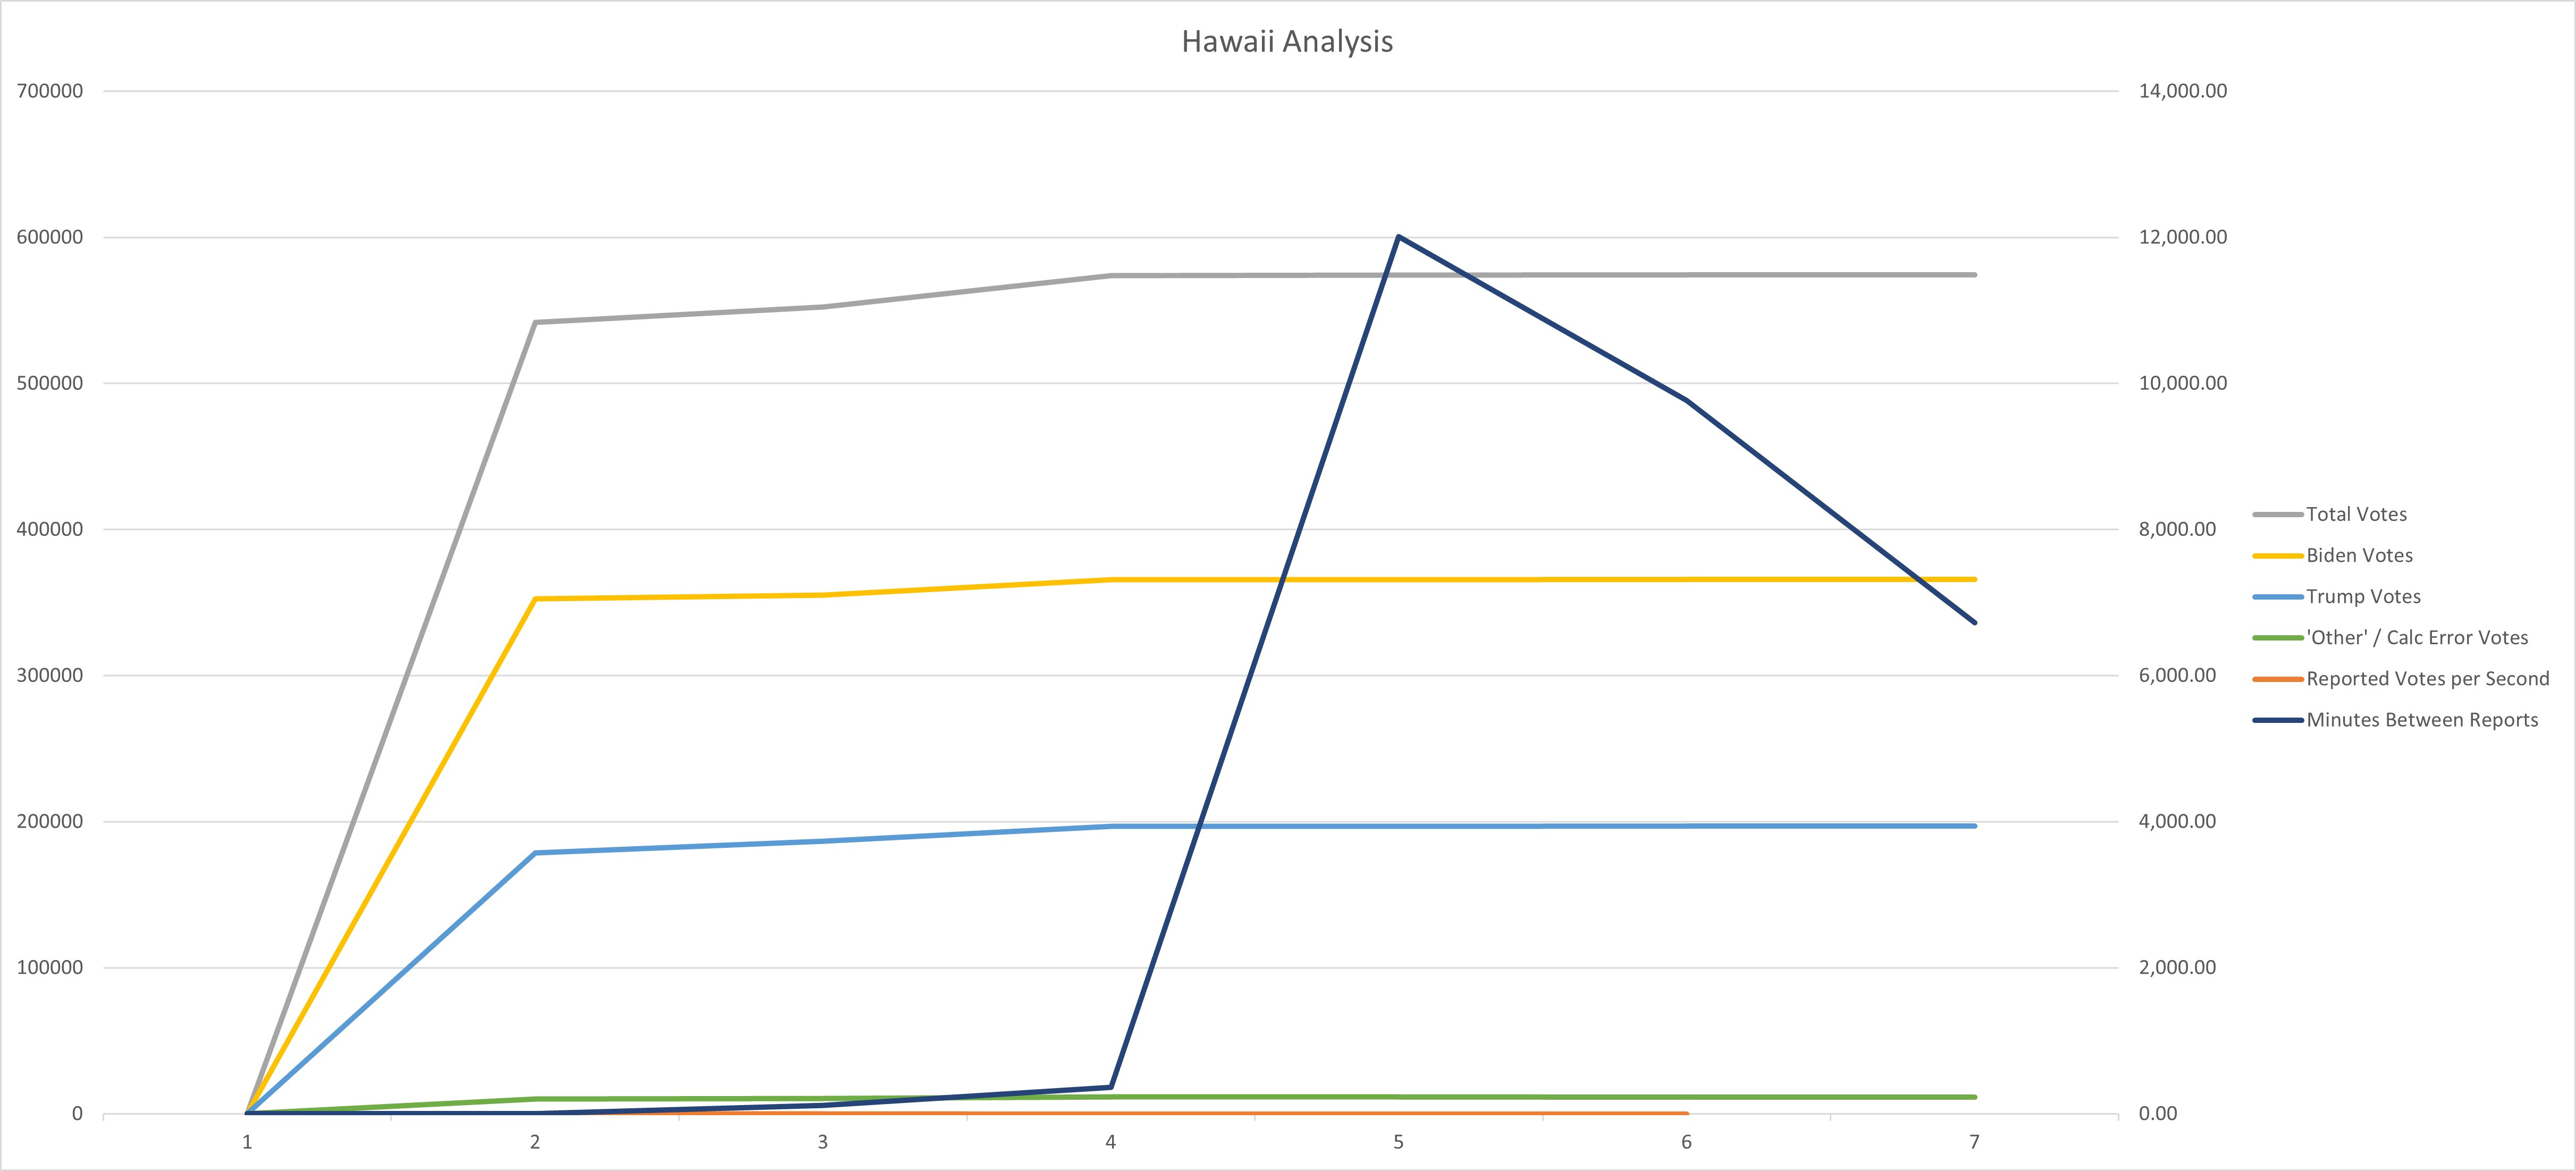
Hawaii reported at the 99th percentile on the morning of November 4th and had two other tabulations by November 10th.
The vote tabulations such as they were - were proportional between the candidates.
Hawaii had no audit transactions through the end of their tabulations.
(Note: Hawaii was not included in the original ‘Pede’ data set. I added it from the NYT directly, converting the .JSON to .csv with the Python script. So the data here is reported through November 24th with no change from November 19th.)
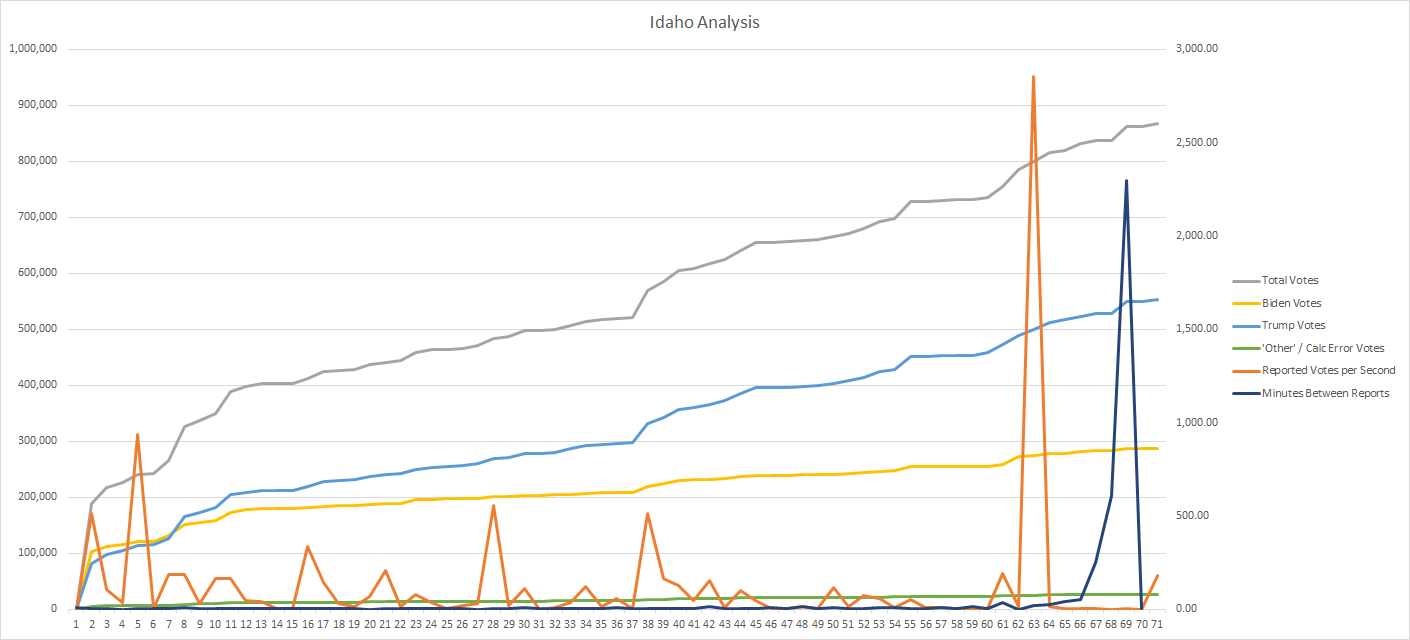
Idaho featured steady vote count tabulations with a single high tabulation rate posting at the 99th percentile.
All tabulations appear to feature proportionality among the candidates.
President Trump won by a large margin in Idaho, collecting almost 64% of the vote which is greater than Biden won his home state by - and Idaho with almost 173% more votes cast than Delaware.
Idaho did not appear to issue any audit transactions though November 10th.
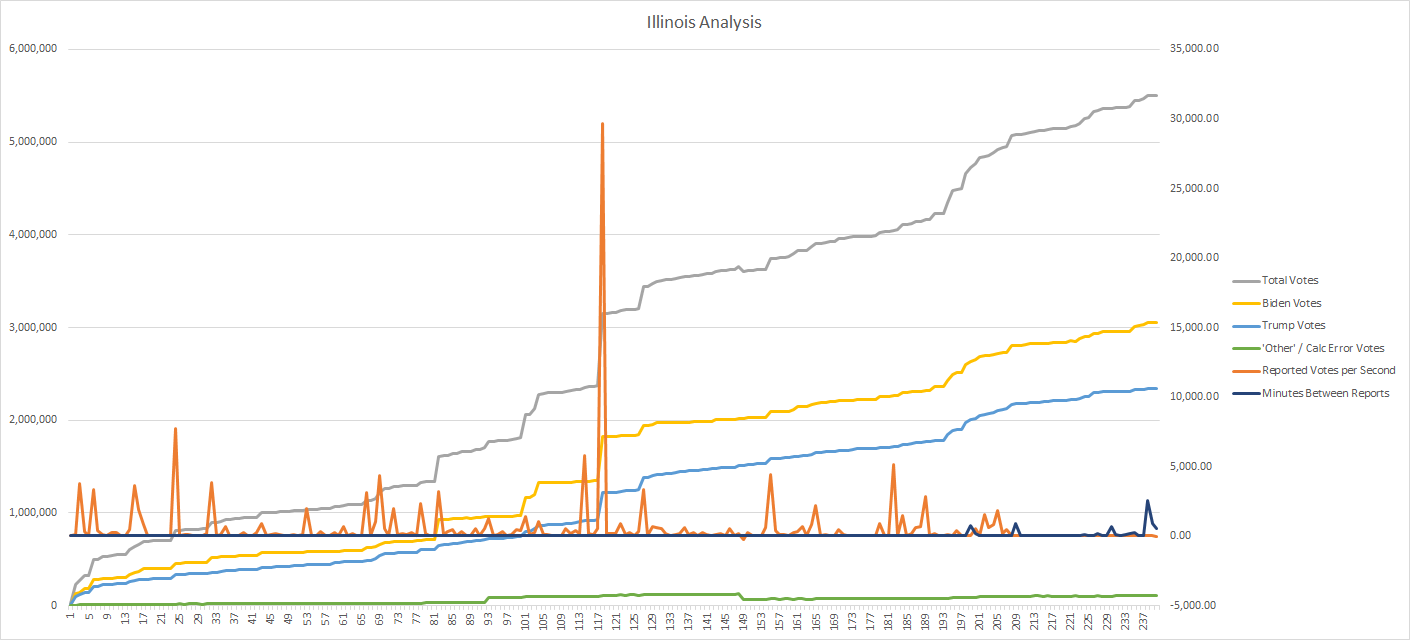
Illinois featured a steady tabulation rate. At the 38th percentile of the tabulation, a very large tabulation of 771,609 votes were tabulated (which pushed the tabulation percentile to the 50th percentile) which could have reflected mail-in / absentee votes.
All tabulations appear to be proportional, even the very large tabulation at the 50th percentile. Illinois reached tabulating to the 90th percentile by November 10th (its last entry was on November 9th during this period.)
Oddly, at the 59th percentile, an audit transaction was committed that subtracted 59,430 votes from the third party total - almost 48% of the total third party votes to that point. There does not seem to be any “positive” audit transactions to juxtapose with this transaction, and the third party votes never recovered to their previous level by November 10th.
The last audit entry on November 9th reduced the overall count by 455 votes in favor of President Trump by 59 votes.
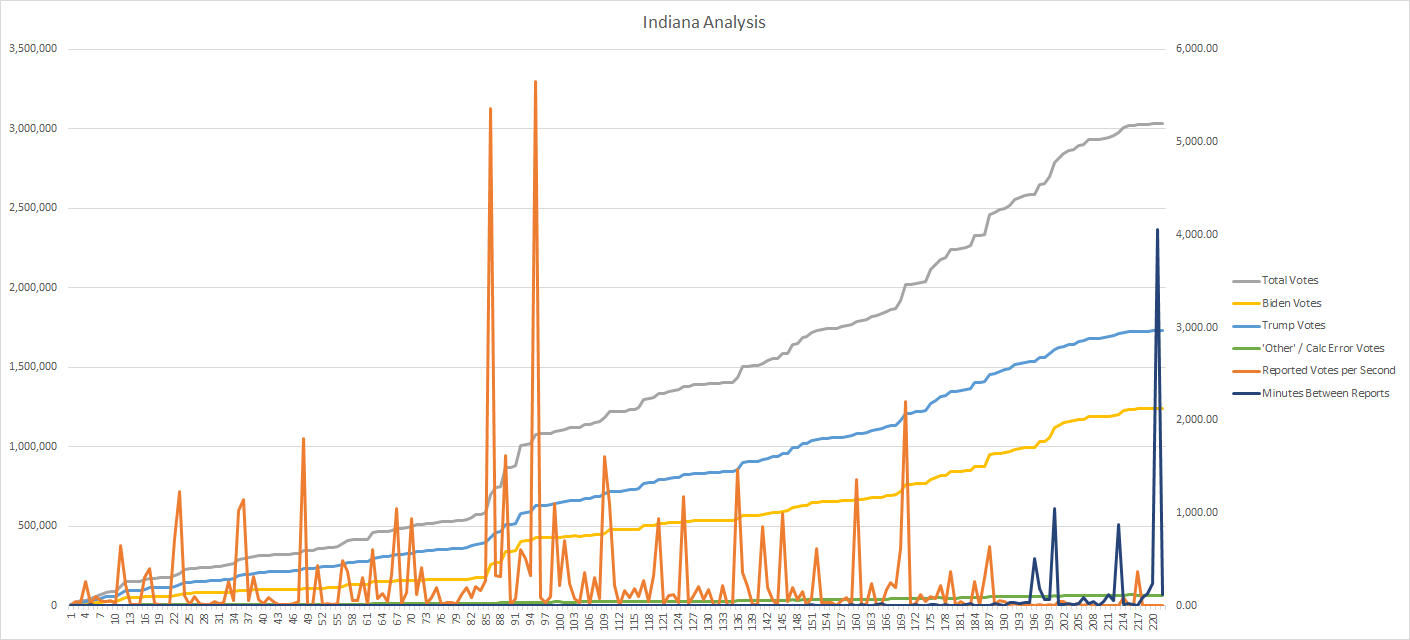
Indiana featured a steady tabulation rate with very little tabulation tail by November 10th. There were two relatively high reported tabulation rate updates around the 23rd to 35th percentile.
All tabulations appear to be proportional. By November 10th, Indiana had tabulated to the 99th percentile of the vote.
Indiana did not apparently issue any audit transactions.
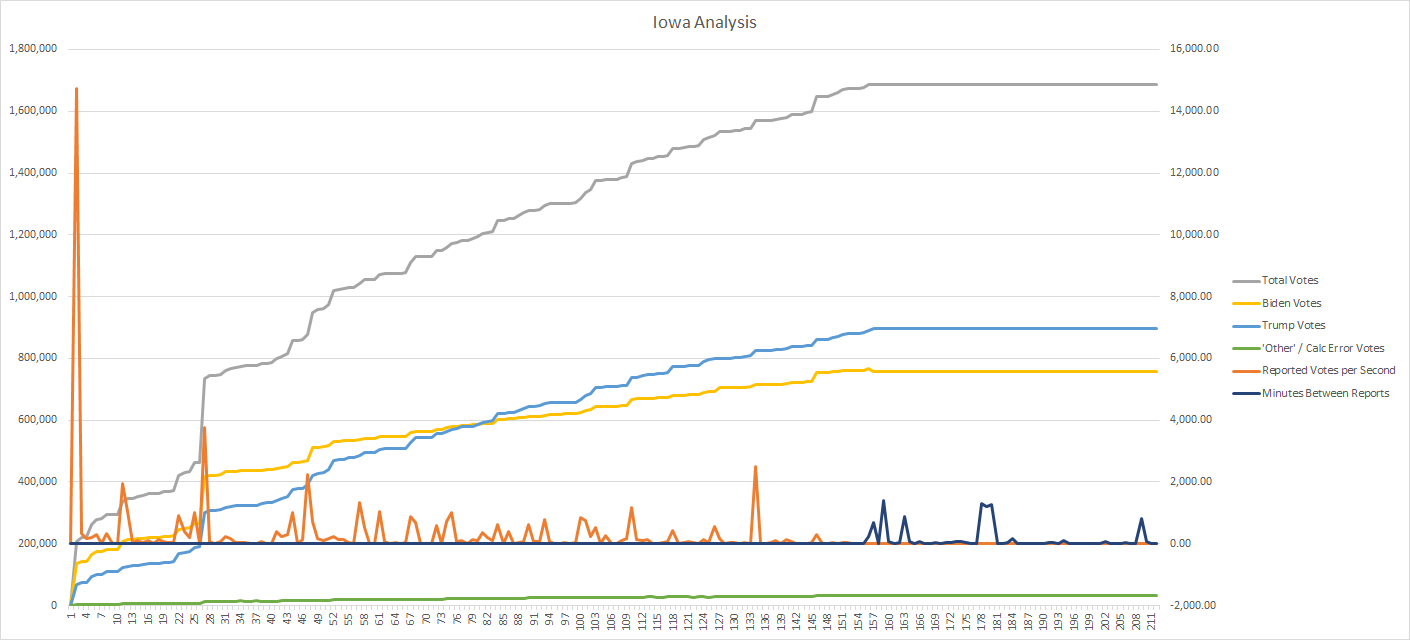
Iowa featured a very early reported tabulation rate spike, likely due to pre-counted mail-in / absentee votes.
There was a large (for Iowa) tabulation of 269,751 votes with a 135% ratio for Biden that moved the tabulation from the 25th to the 40th percentile. Iowa tabulated to the 98th percentile by November 10th.
All of the tabulations appear to be proportional.
Iowa issued a single audit transaction at the 92nd percentile of tabulation - deducting a total of 477 votes, 39 in favor of Biden.
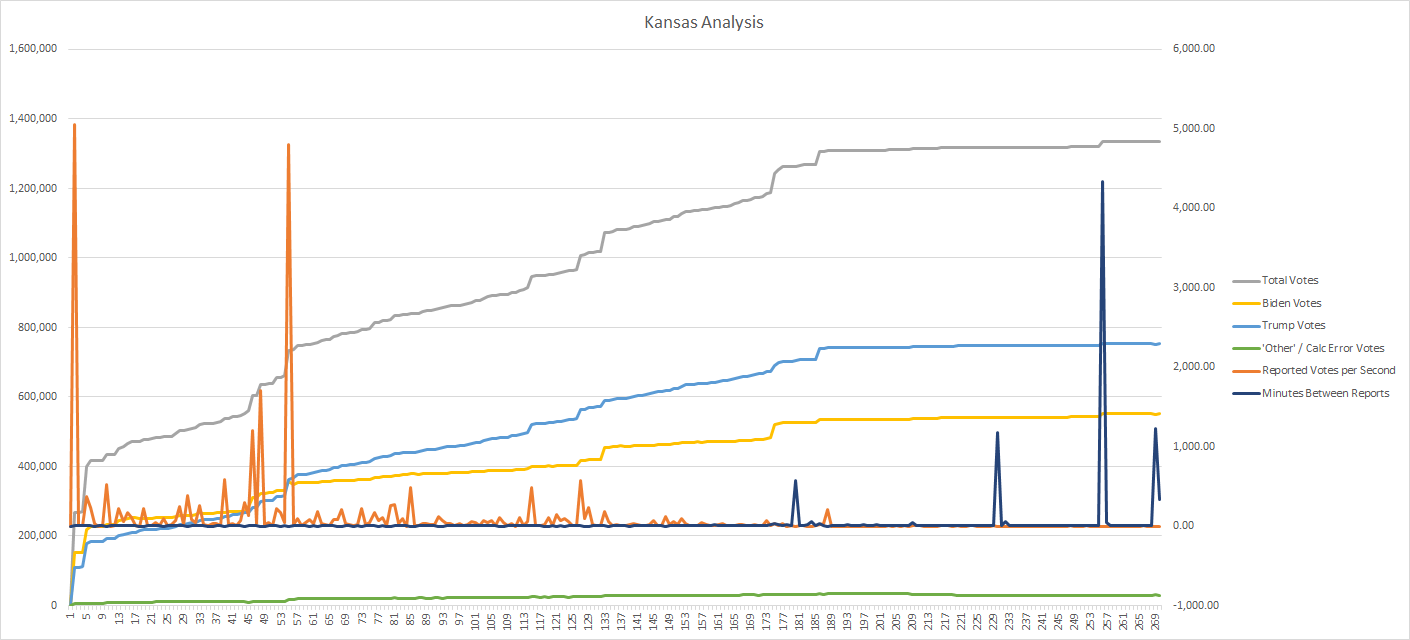
Kansas featured a very early reported tabulation rate spike, likely due to pre-counted mail-in / absentee votes. Then a fairly good bell curve of reported tabulation rates.
All of the tabulations appear to be proportional. Kansas was able to tabulate to the 99th percentile by November 10th.
Kansas issued three audit transactions at the end of the tabulation by November 10th. The first removed 1,628 votes, 247 in favor of Biden. The second and third offset each other plus and minus 1,414 votes.
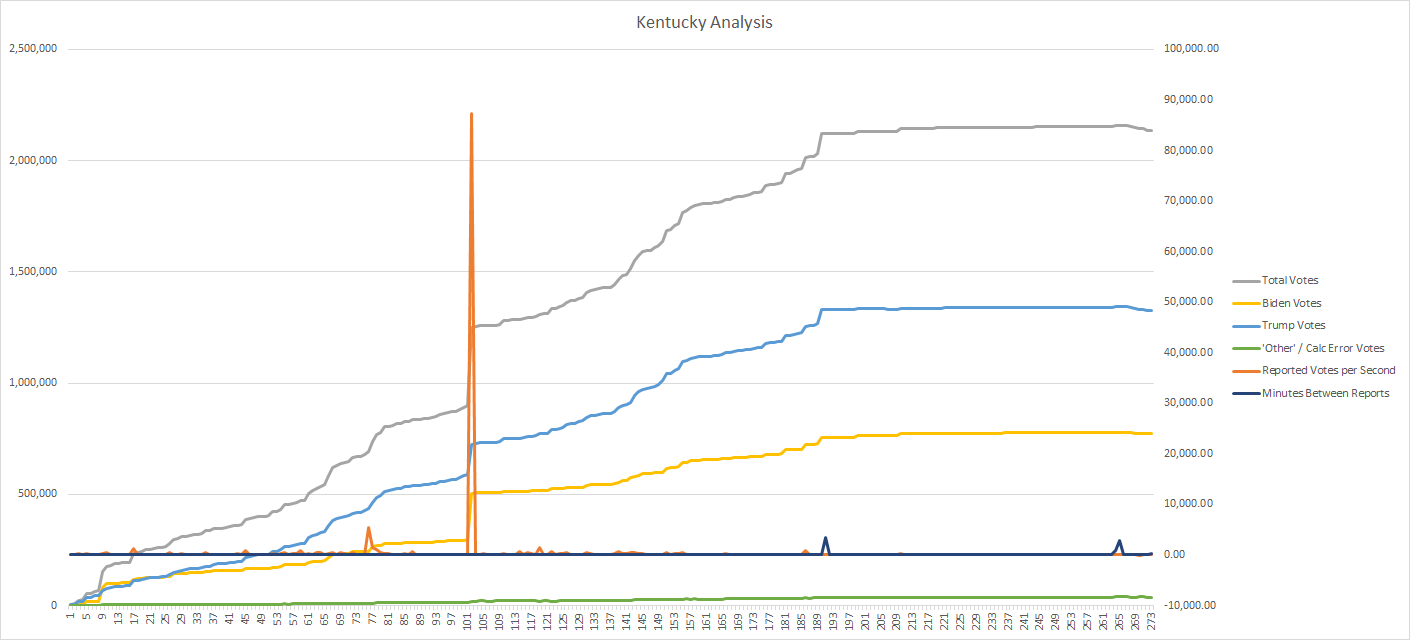
Kentucky featured a fairly light reported tabulation rate until the 39th percentile when a very large reported tabulation rate spike occurred, which might mark the completion of one large tranche of urban votes, unless it represented the completion of the mail-in / absentee tabulation. That tabulation was highly in favor of Biden but not disproportional as Biden’s ratio was about 152%.
The tabulations all appear to be proportional between the candidates.
At the 98th percentile calculation. KY issued 5 separate negative audit transactions, none of them appear to be intended to offset another. They favor Biden by 12,654 votes in total.
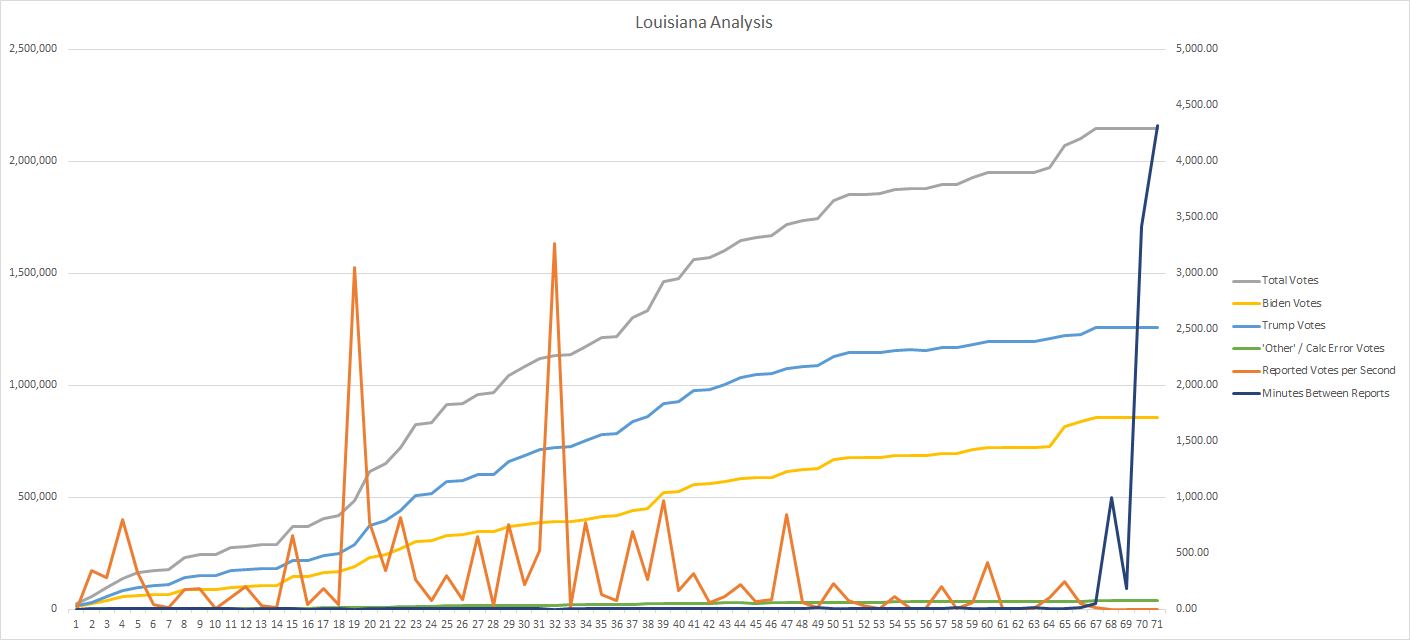
Louisiana is another state featuring steady counting with a nice reported rate bell shaped curve.
By November 10th, Louisiana was able to tabulate to the 99th percentile of the vote. The delays in tabulations occurred after achieving the 90th percentile tabulation.
The tabulations all appear to be proportional between the candidates.
Louisiana did not appear to issue any audit transactions through November 10th.
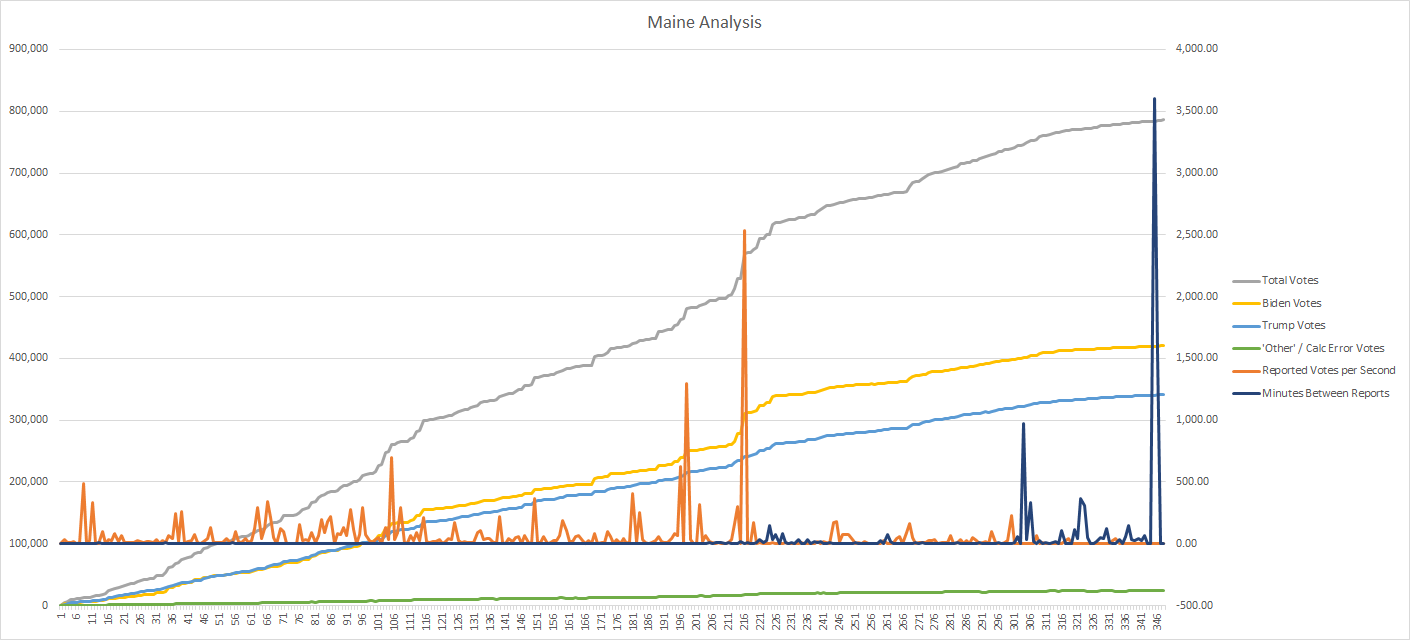
Maine featured steady tabulation without overt signs of tabulating mail-in / absentee votes.
By November 10th, Maine was able to tabulate to the 91st percentile of the vote.
The tabulations all appear to be proportional between the candidates.
At the 72nd percentile, Maine election officials committed a small audit transaction involving a total of 35 votes, about 4 votes in favor of President Trump.
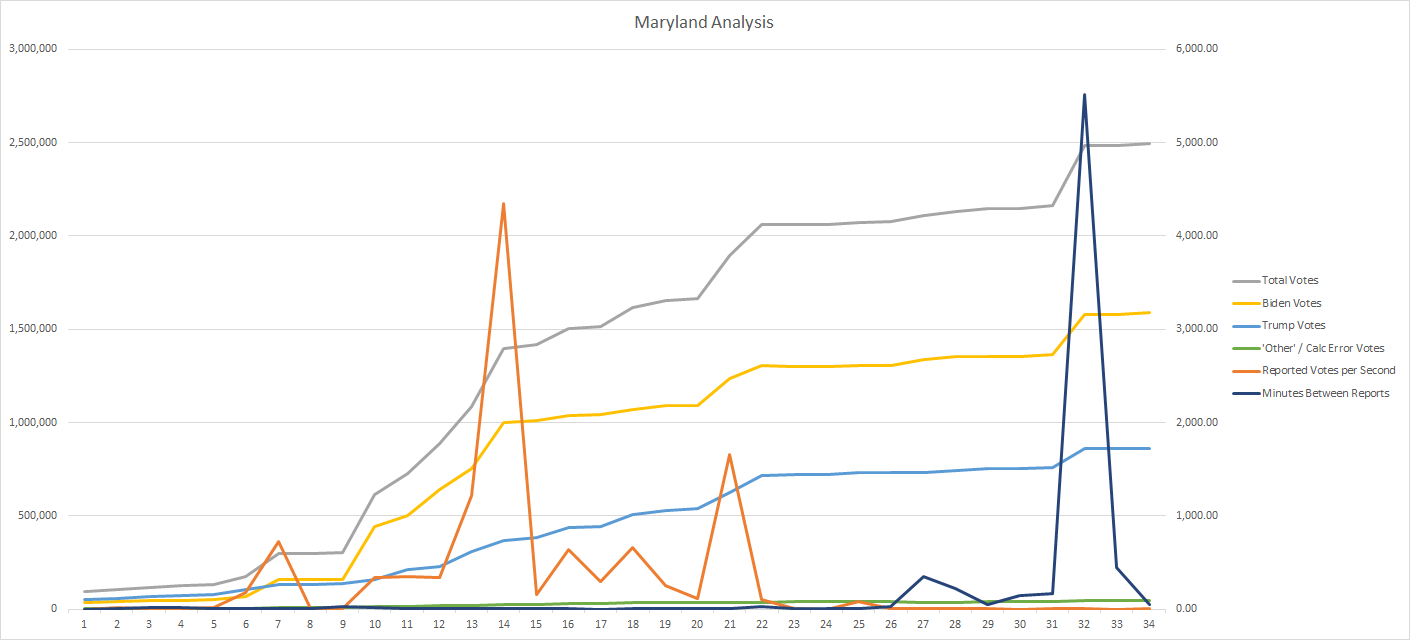
Maryland featured steady tabulation without a large influx of mail-in / absentee ballots at the beginning of the tabulation. It is possible that mail-in / absentee ballots were tabulated near the end of tabulation as there was a very large tabulation after a delay of four days to the 80th percentile of the vote.
Maryland was able to tabulate to the 80th percentile of the vote by November 10th.
The tabulations, even the very large tabulation to the 80th percentile, all appear to be proportional between the candidates.
There is a strange tabulation at the 68th percentile. The total vote increased by 29,363 votes. However, 3,685 were removed from the third party calculation - which is outside the 0.1% margin so is likely a correct calculation. 203 votes were removed from President Trump, but that is within the 0.1% margin so we can’t know if that is determining. In any event, Biden received 33,427 votes when the total increased by 29,363.
Maryland did not appear to have committed any audit transactions to November 10th.
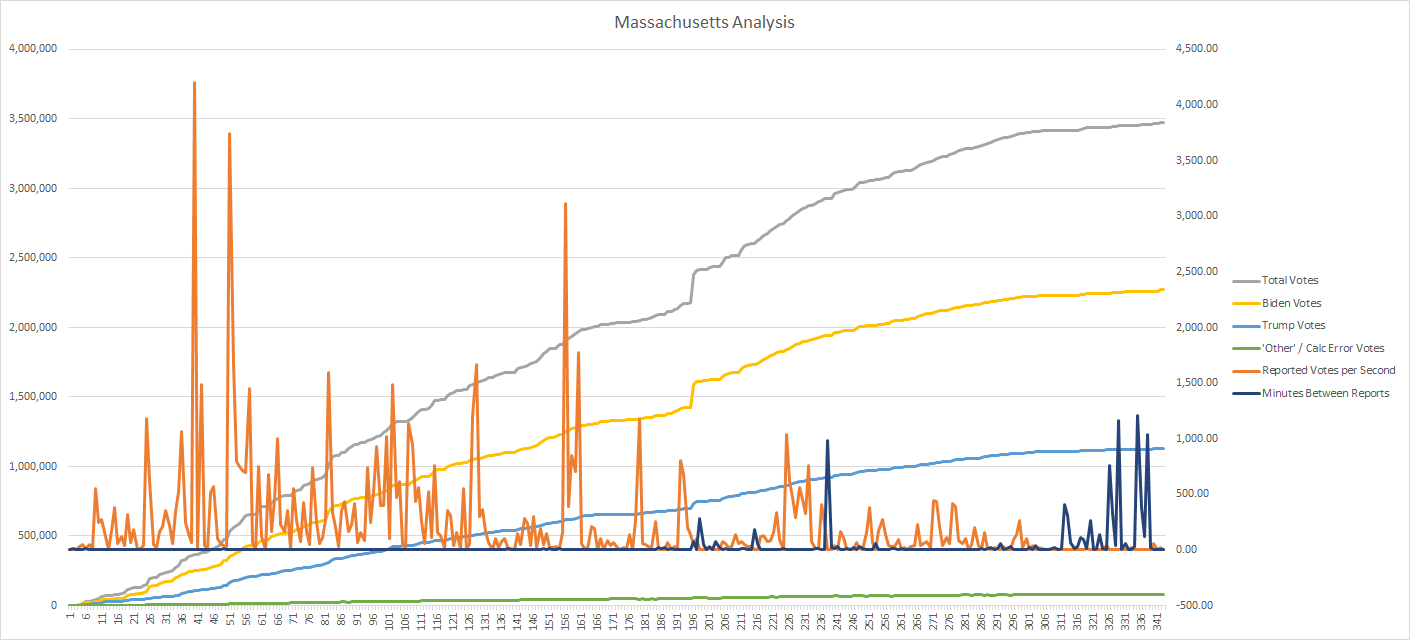
Massachusetts featured strong early vote tabulations forming a left shifted bell curve in reported tabulation rates.
There was a slightly disproportional tabulation to the 64th percentile in favor of Biden with a 520% ratio. Otherwise the other tabulations appear to be proportional between the candidates.
Massachusetts was able to tabulate to the 93rd percentile of the vote by November 10th.
Massachusetts did not appear to commit any audit transactions by November 10th.
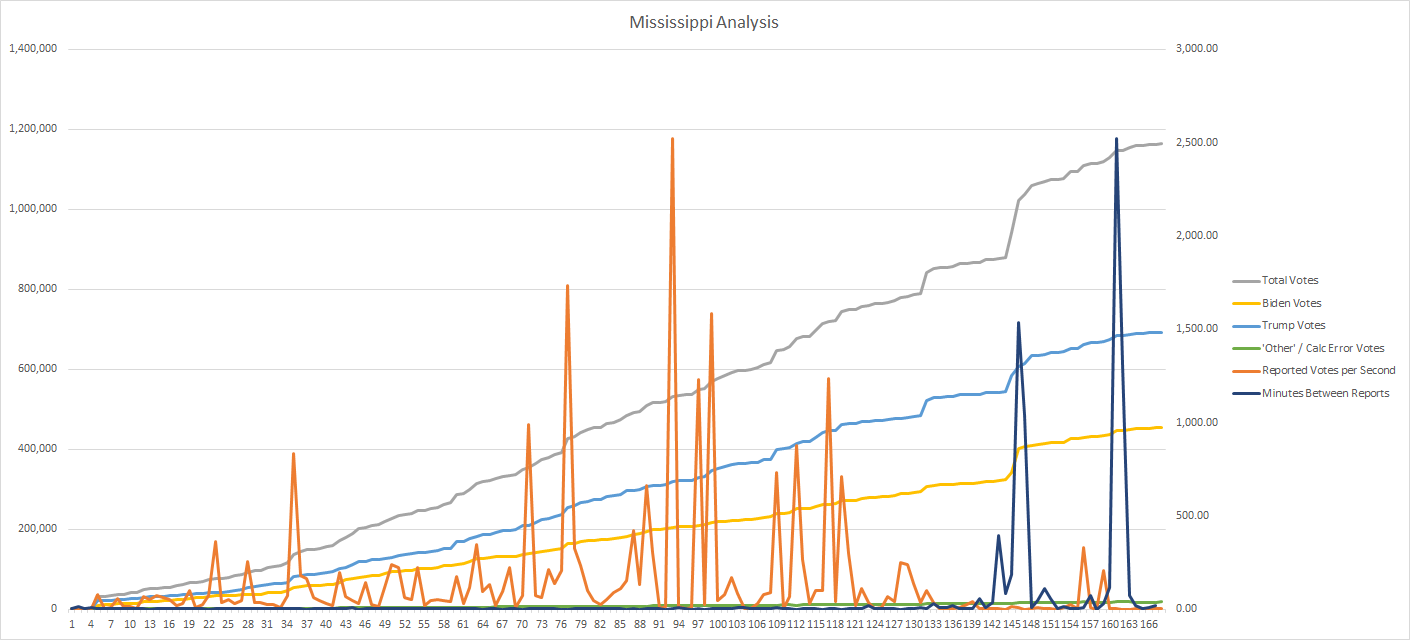
Mississippi featured strong vote tabulations with the reported tabulation rates forming a bell curve centered in the vote tabulations.
The tabulations all appear to be proportional between the candidates.
Mississippi was able to tabulate to the 97th percentile by November 10th.
Mississippi did not appear to have committed any audit transactions by November 10th.
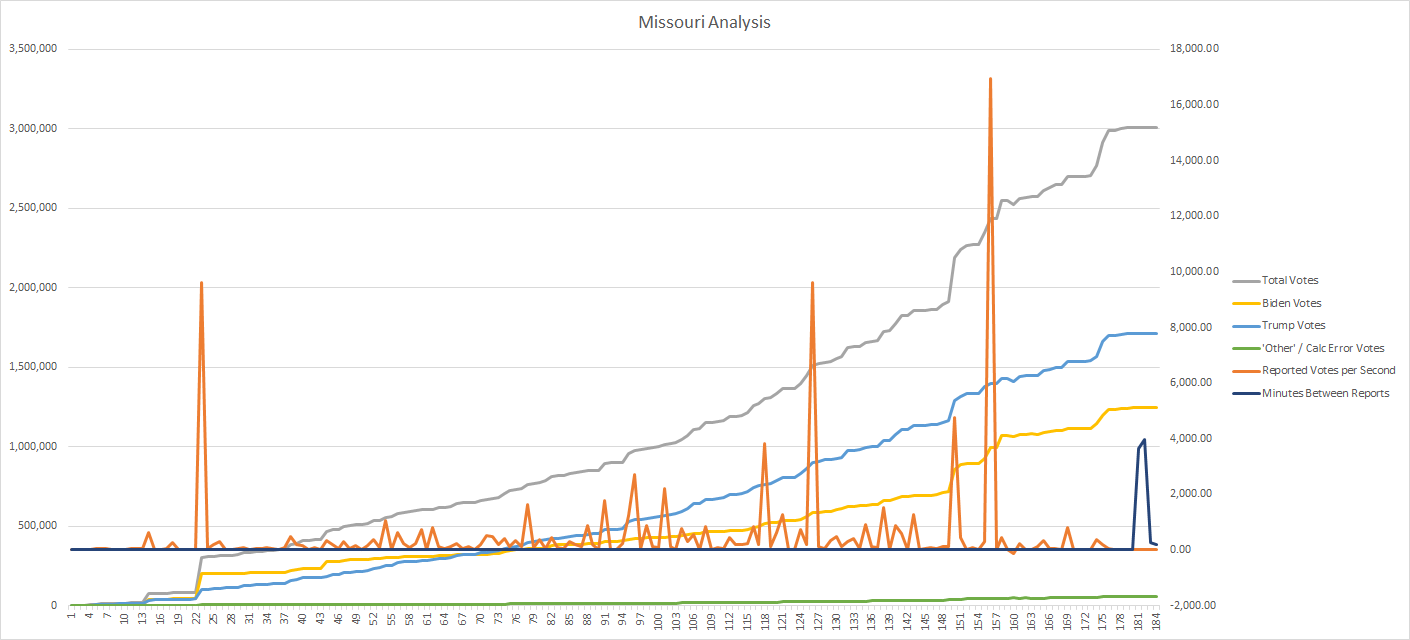
Missouri featured steady vote tabulations with later tabulations showing higher tabulation rates. It is not determinable whether later tabulations evidence mail-in / absentee vote tabulation or larger urban area tabulations.
The tabulations all appear to be proportional between the candidates.
Missouri was able to tabulate to the 99th percentile by November 10th.
At the 82nd percentile, Missouri committed an audit transaction affecting 20,729 votes. The audit transaction favored Biden by 10,481 votes.
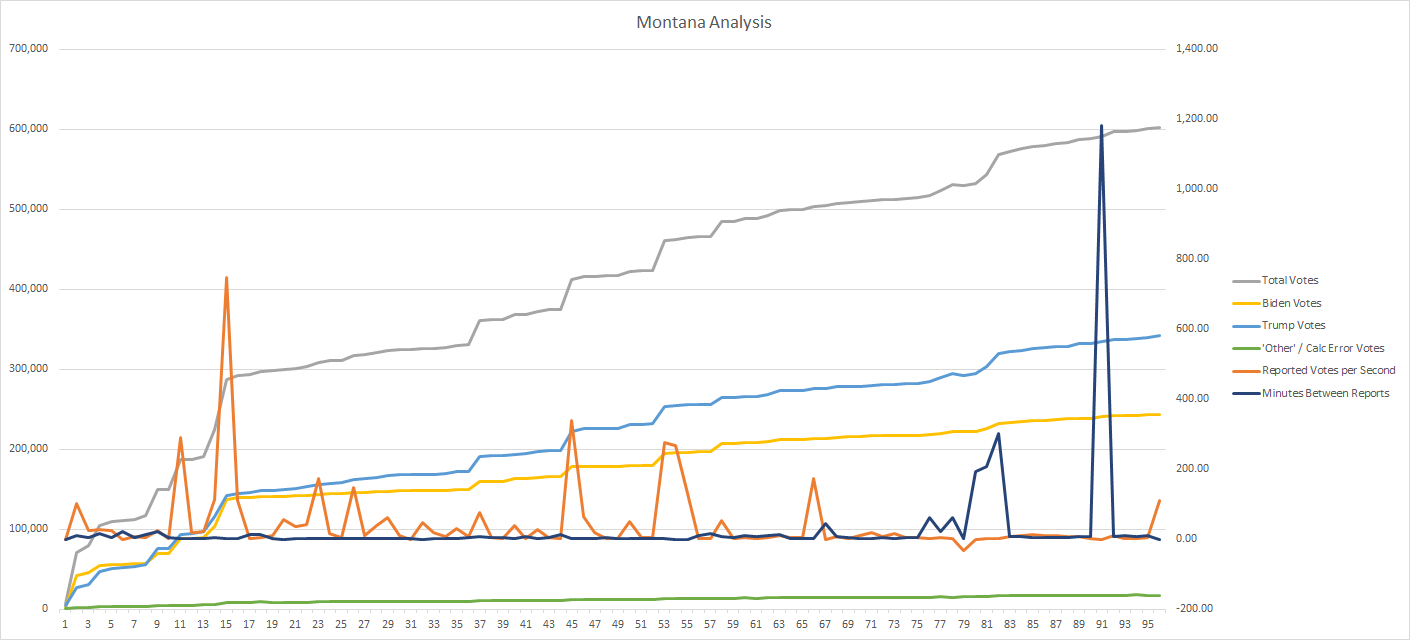
Montana featured an early rise in vote tabulation rates possibly due to early counting of mail-in / absentee ballots.
The tabulations all appear to be proportional between the candidates.
Montana was able to tabulate to the 99th percentile by November 10th.
At the 90th percentile, there is a possible audit transaction (indeterminable because there is no adjustment for both major parties and / or third party votes.) In any event, that tabulation reports a reduction in the total vote by 1,276 votes, and removes 2.299 votes from President Trump. Biden was favored by 2,827 votes with this transaction.

Nebraska featured a very large vote tabulation rate spike in the early tabulations suggesting that it counted mail-in / absentee votes early.
The tabulations all appear to be proportional between the candidates.
Nebraska was able to tabulate to the 99th percentile of the vote by November 10th.
At the 99th percentile it appears that Nebraska issued two individual audit transactions, each which reduced the vote count for each major candidate individually. The first removed 23,727 votes for Biden. The second removed 30,087 votes from President Trump. When the balance of the transaction tabulations are netted out, the net difference in the two transactions favor President Trump by 836 votes. The relatively large size of the apparent transactions may be due to them being reported in two separate lines (rows) in the Edison data.
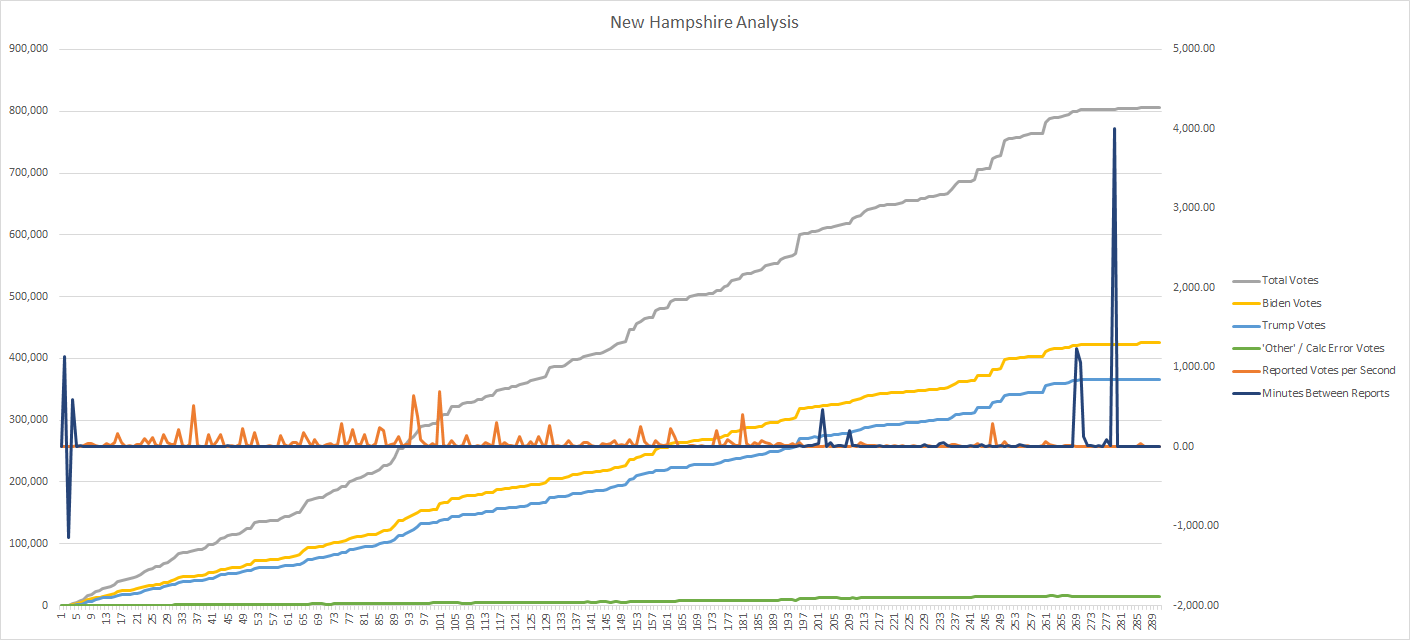
New Hampshire, after what appears to be a very small audit transaction affecting 26 votes at the beginning of tabulation, proceeded at a moderate tabulation rate. A relatively large number of tabulations were reported for a state tabulating relatively few votes.
The tabulations all appear to be proportional between the candidates.
New Hampshire was able to tabulate to the 99th percentile of the vote by November 10th.
A small audit transaction at the 99th percentile was committed that affected 90 votes, with about 6 votes in favor of President Trump.
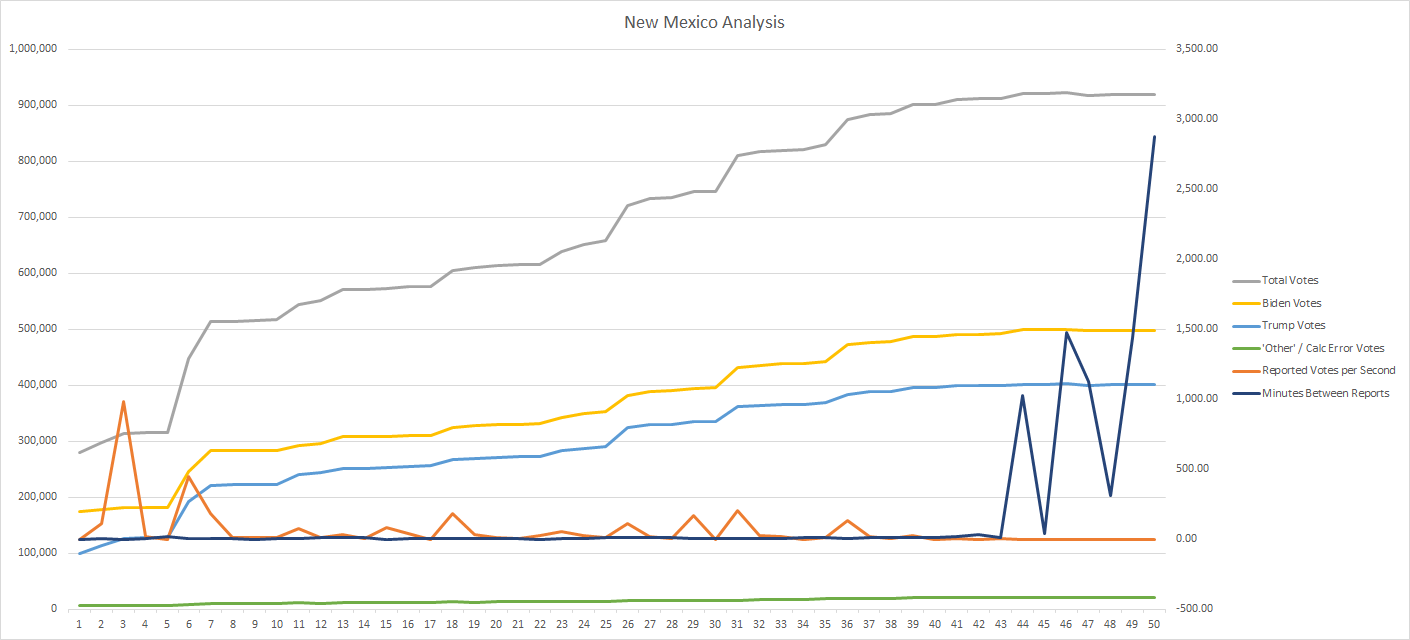
New Mexico featured large tabulation rates at the beginning of tabulation suggesting early counting of mail-in / absentee votes, then featured steady tabulation. Large delays were featured near the end of tabulation.
The tabulations all appear to be proportional between the candidates.
New Mexico was able to tabulate to the 99th percentile of the vote by November 10th.
New Mexico committed an audit transaction at the 99th percentile of the vote that affected 4,610 votes, and favored President Trump by 489 votes.
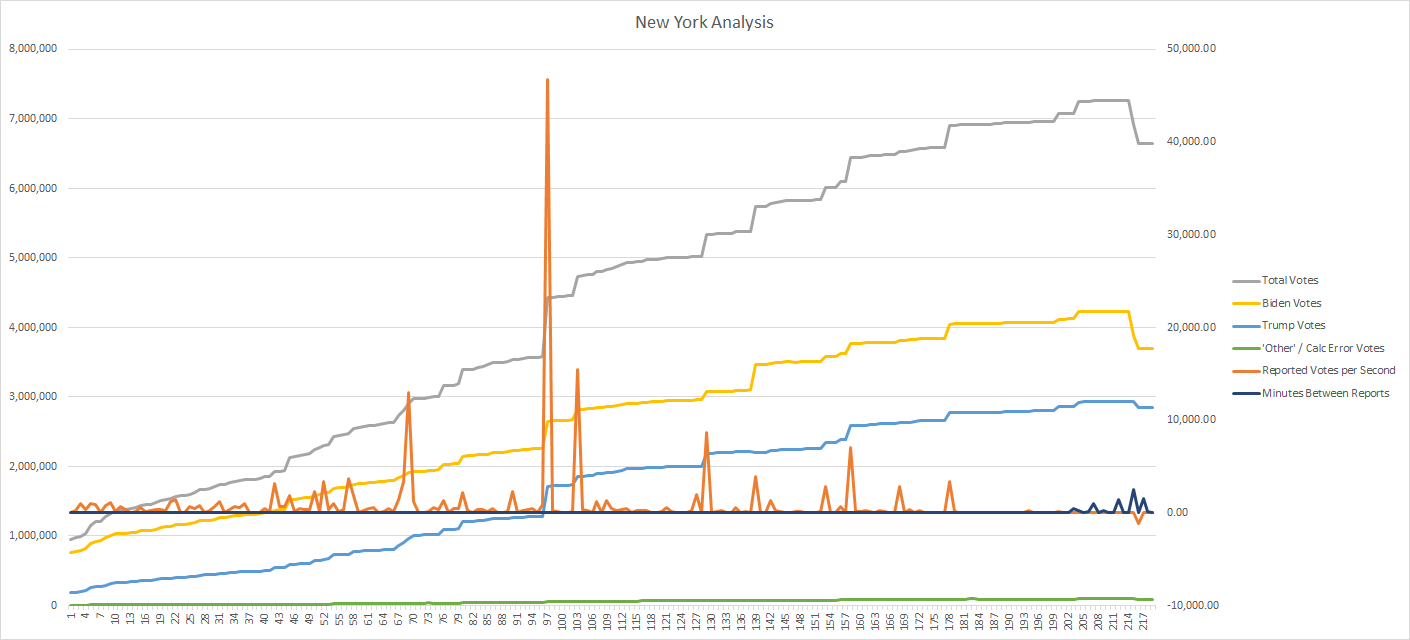
New York featured steady tabulation, with a nice bell curve in reported tabulation rates near the middle of tabulations.
All tabulations appear to be proportional between the candidates.
New York was able to tabulate to the 84th percentile of the vote by November 10th.
New York committed two extremely large audit transactions at the 84th percentile. The first removed 355,414 votes from Biden, the second removed 90,126 from President Trump and removed 180,599 from Biden. The main question for New York is: Who thought New York needed 536,013 pocket votes for Biden? At least they waited until the 84th percentile, which is the main reason I didn’t look at New York as a bad actor. These may be huge transactions, but at least they weren’t committed during the main tabulation sequence.
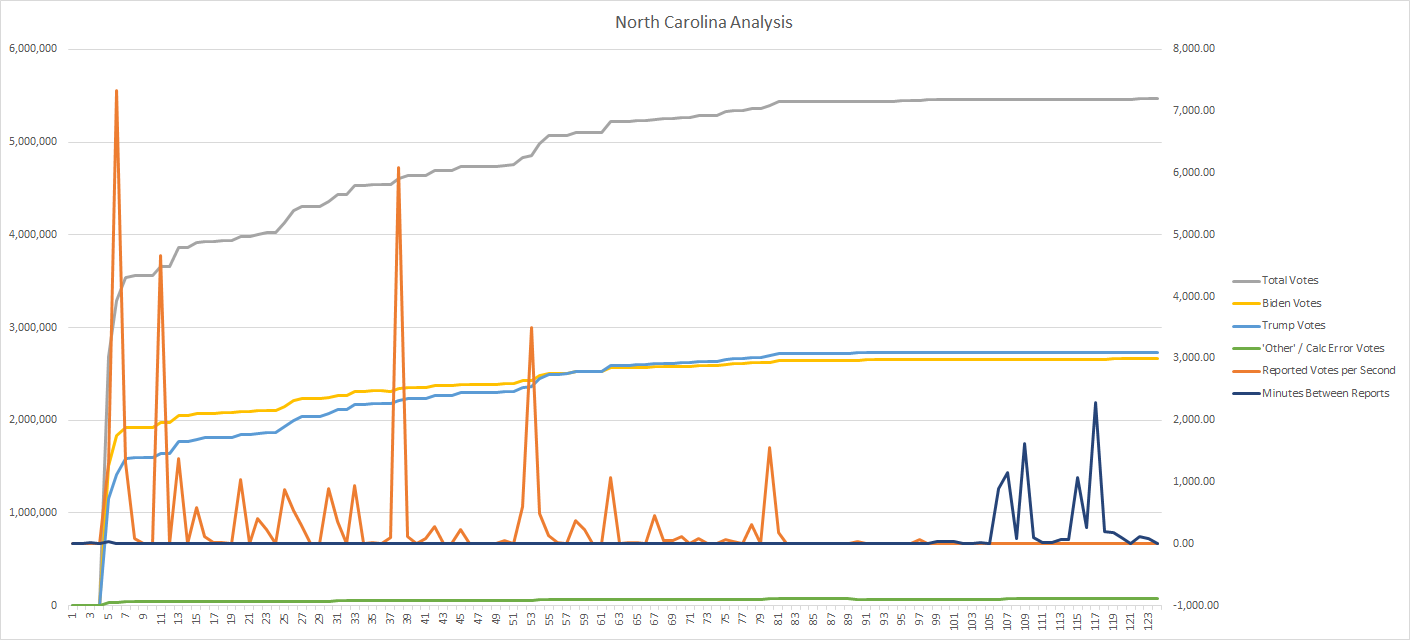
North Carolina featured very large vote tabulation rates at the beginning of the tabulations which suggests early counting of mail-in / absentee ballots.
North Carolina also had a very long tabulation tail.
All tabulations appear to be proportional between the candidates. President Trump overtook Biden over the course of 26 proportional tabulations from the 85th to the 95th percentile of the vote.
North Carolina was able to tabulate to the 98th percentile of the vote by November 10th.
North Carolina appeared to commit an audit transaction at the 95th percentile of the vote removing 4,463 votes from President Trump and 4,491 from Biden which favors President Trump by 28 votes.
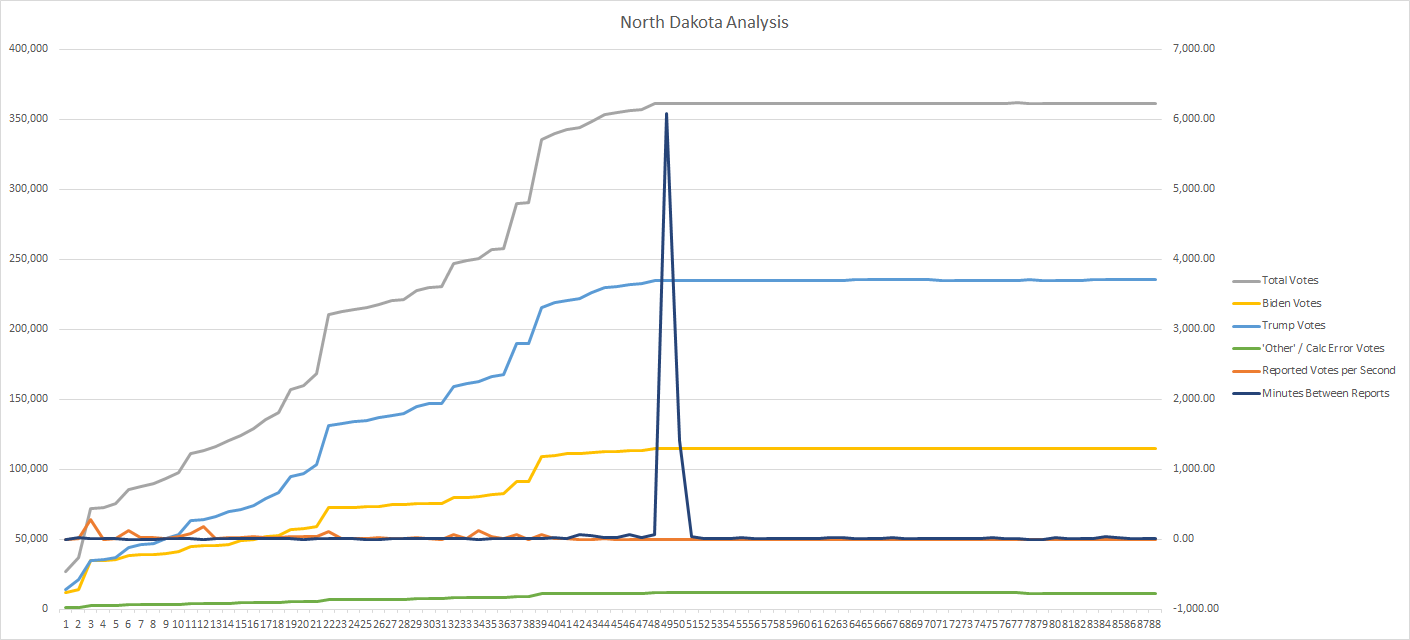
North Dakota featured steady counting of a relatively few number of votes over the course of 88 tabulations. There was a significant delay at the beginning of the 99th percentile of the vote. A long tail for the 99th percentile to November 10th yielded 377 additional votes.
All tabulations appear to be proportional between the candidates.
North Dakota was able to tabulated to the 99th percentile of the vote by November 10th.
There is at least one audit transaction committed at the 99th percentile that affected a total of 243 votes, favoring Biden by 81 votes.
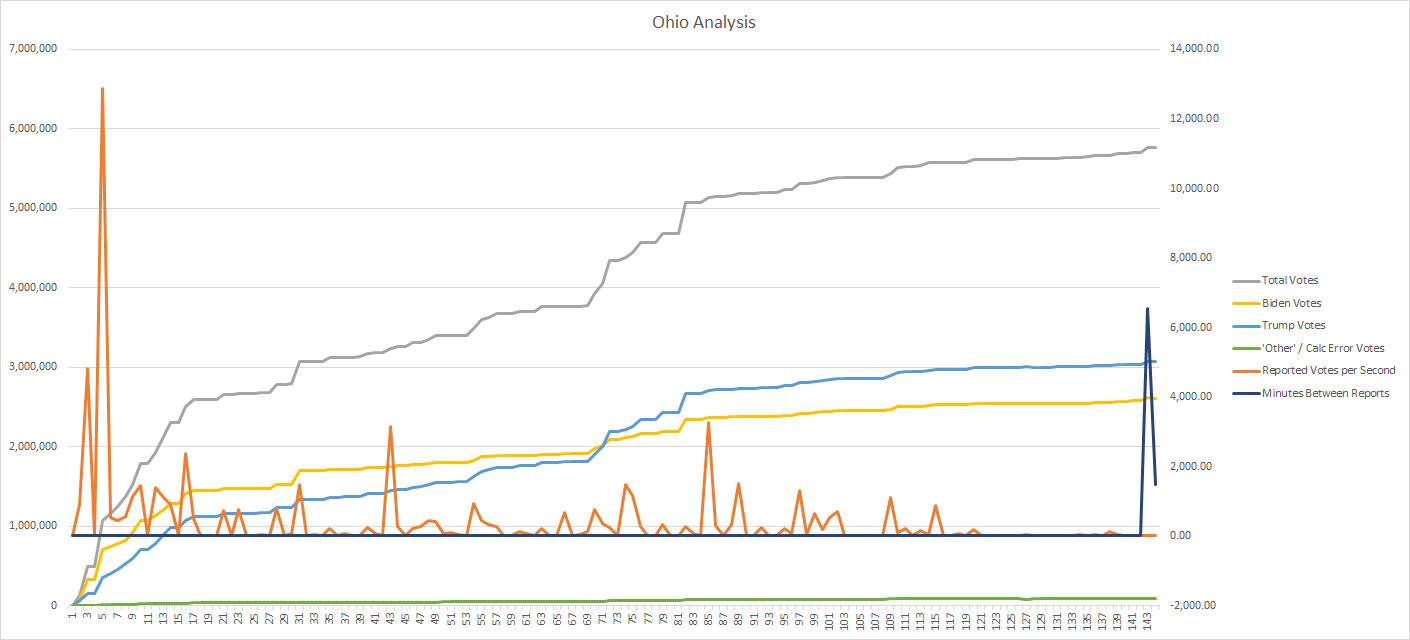
Ohio featured very large spikes at the beginning of vote tabulation which suggests early tabulation of mail-in / absentee votes. These votes gave Biden a substantial lead in the early vote. President Trump overtook Biden in a series of tabulations from the 62nd to the 80th percentile of the vote.
All tabulations appear to be proportional between the candidates.
Ohio was able to tabulate to the 95th percentile of the vote by November 10th.
It appears that Ohio committed a single audit transaction at the 95th percentile of the vote. The net of the transaction was in favor of President Trump by 11,126 votes.

Oklahoma featured an initial spike in reported tabulation rate which suggests early counting of mail-in / absentee votes. It then features steady tabulations forming a bell curve in reported tabulation rates.
All tabulations appear to be proportional between the candidates.
Oklahoma was able to tabulate to the 99th percentile by November 10th.
Oklahoma did not appear to commit any audit transactions by November 10th.

Oregon featured multiple early spikes in reported tabulation rates which reflects the fact that Oregon is a 100% mail-in ballot state.
All tabulations appear to be proportional between the candidates.
Oregon was able to tabulate to the 97th percentile of the vote by November 10th.
Oregon did not appear to post any audit transactions by November 10th.
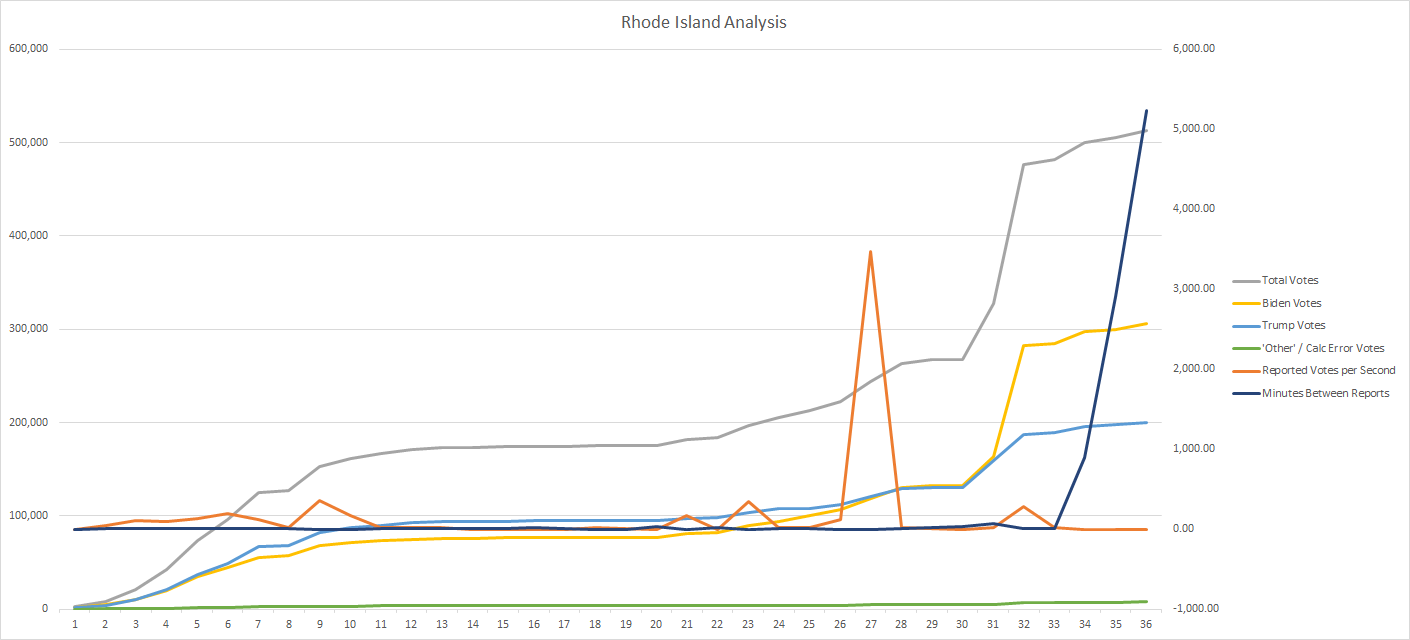
Rhode Island tabulated steadily with no signs of early mail-in / absentee vote tabulation. There were large tabulations near the end of the tabulation sequence. One of those was slightly disproportional in favor of Biden at a 422% ratio. It is indeterminant whether that reflects tabulation of mail-in / absentee ballots or Rhode Island’s urban dominant Providence County.
Other wise, the tabulations appear to be proportional between the candidates.
Rhode Island was able to tabulate to the 99th percentile of the vote by November 10th.
Rhode Island did not appear to commit any audit transactions by November 10th.
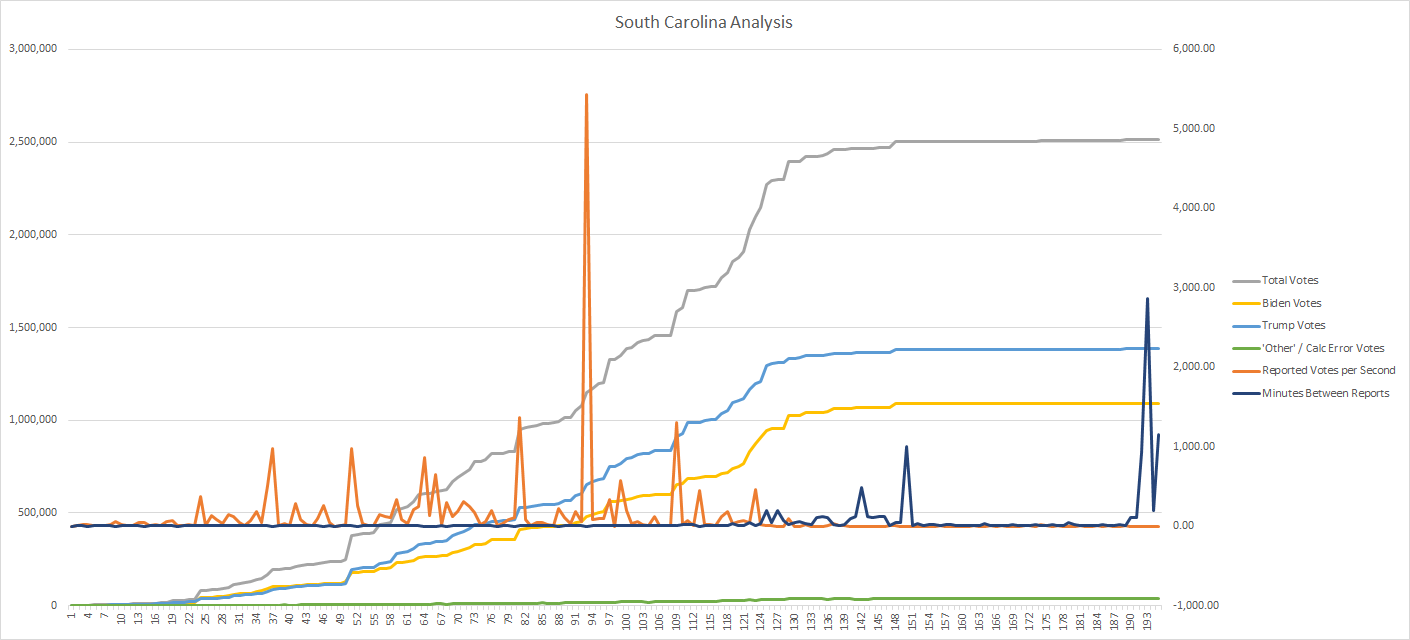
South Carolina featured a nice bell curve of reported vote tabulation rate centered in the middle of the vote tabulations.
The tabulations appear to be proportional between the candidates.
There is one unusual tabulation report at 1:52 AM on November 4th which subtracts 968 votes from President Trump - which is larger than the 0.1% margin at that point in time - Biden received a net 3,460 votes for that tabulation when the total vote increased by 1,148 votes.
South Carolina was able to tabulate to the 99th percentile by November 10th.
South Carolina committed an audit transaction at the 99th percentile that affected 2,119 votes, the net of the transaction favored Biden by 248 votes.

South Dakota featured steady counting throughout the tabulation period.
The tabulations appear to be proportional between the candidates.
South Dakota was able to tabulate to the 99th percentile of the vote by November 10th.
South Dakota did not appear to commit any audit transactions through November 10th.
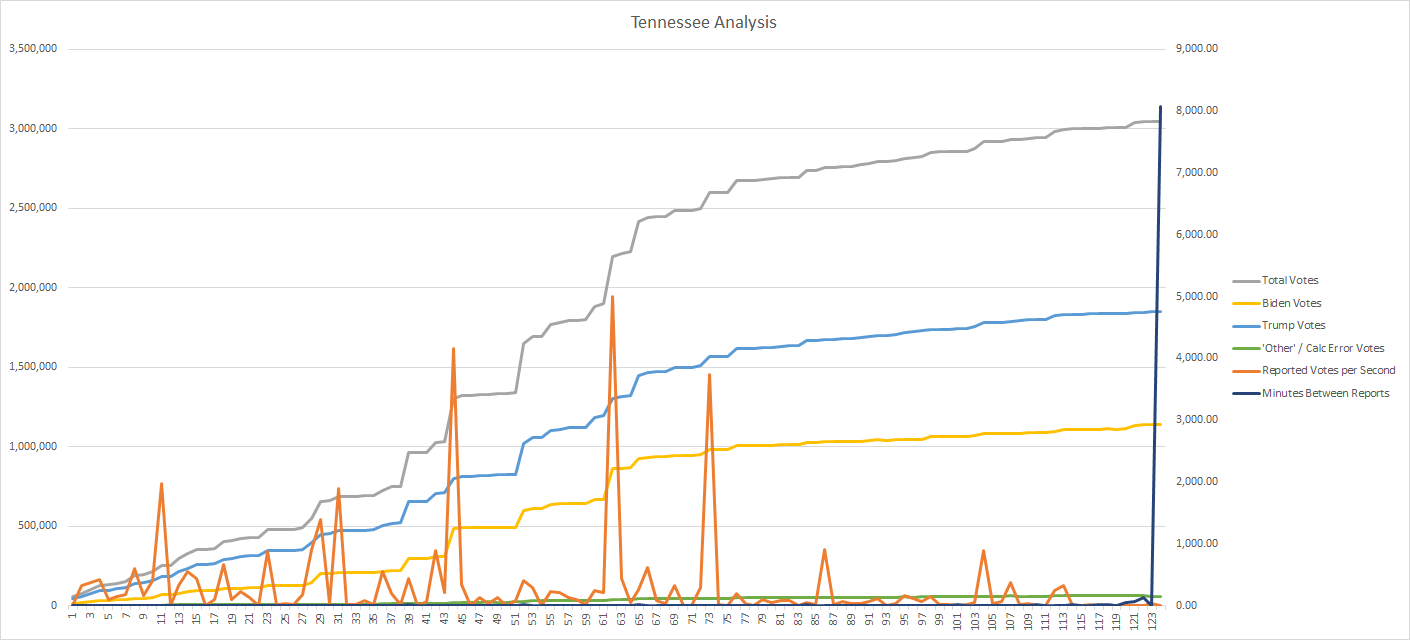
Tennessee featured steady tabulation through the tabulation period forming a nice bell curve in the reported tabulation rates.
The tabulations appear to be proportional between the candidates.
Tennessee was able to tabulate to the 99th percentile of the vote by November 10th.
Tennessee did not appear to commit any audit transactions through November 10th.
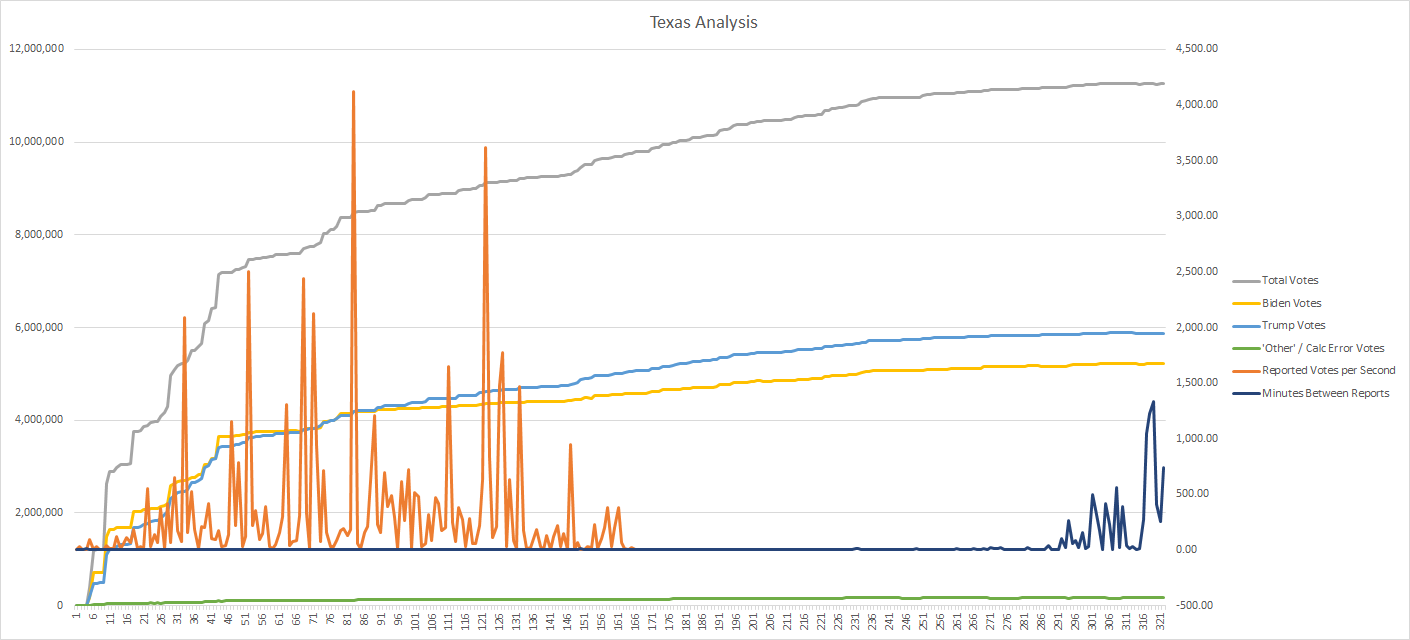
Texas featured very rapid tabulation report rates for a sustained period on November 4th. By 11:46 AM on November 4th, Texas had tabulated well over 11,000,000 votes and had reached the 96th percentile of vote tabulation. They are, along with Florida, the most efficient at tabulating votes. By November 10th, with 32 additional tabulations, Texas tabulated close to another 72,000 votes.
The tabulations appear to be proportional between the candidates.
Texas was able to tabulate to the 99th percentile of the vote by November 10th.
Texas implemented four audit transactions at the 97th and 99th percentile of the vote. The first three affected 25,006 votes with 1,471 votes to Biden’s favor. The last one removed 14,156 votes from President Trump, with a net of 22,835 votes to Biden’s favor.

Utah featured an early spike in reported tabulation rate which suggests early tabulation of mail-in / absentee votes.
The tabulations appear to be proportional between the candidates.
Utah was able to tabulate to the 99th percentile of the vote by November 10th.
There were several long delays near the last 5 tabulations. Some of those resulted in relatively large tabulations - but they were proportional.
There was a single removal of 2,899 votes from the total vote at the 99th percentile. It’s not possible to determine whether that was an audit transaction, but it is likely since it is outside the 0.1% margin. The tabulation favored President Trump by 1,424 votes.
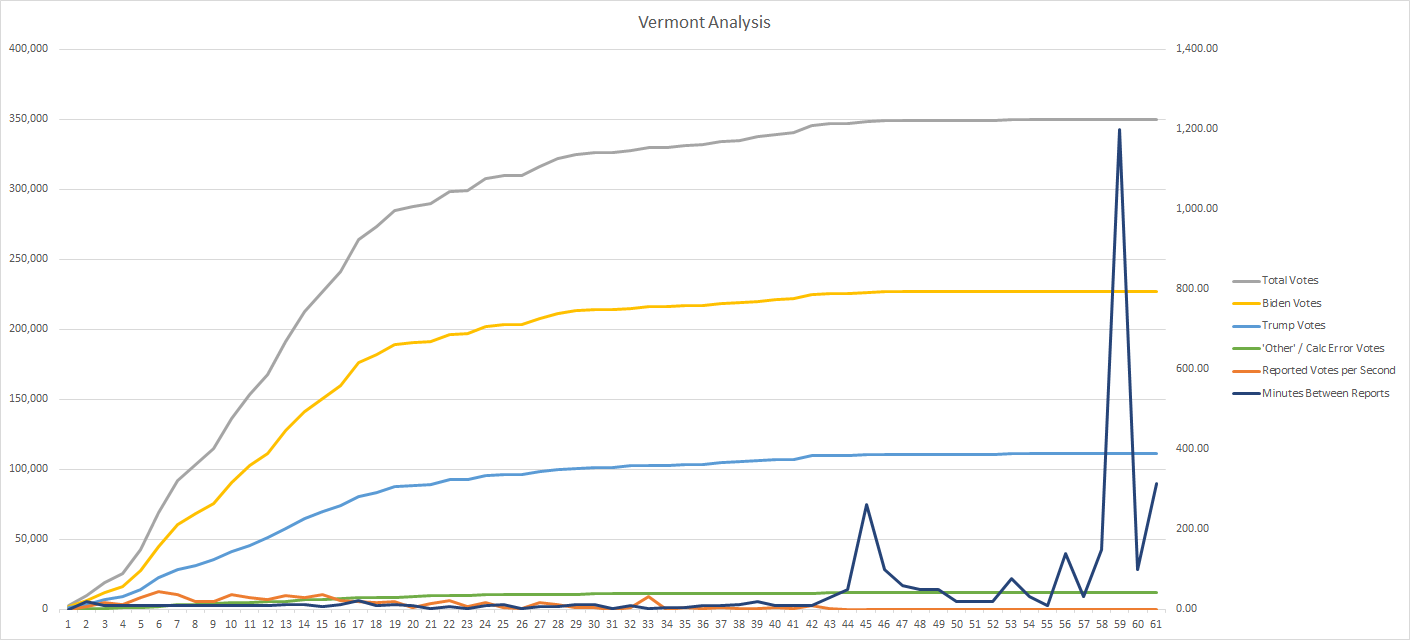
Vermont featured steady tabulation rate reports. There were some significant delays near the end of the tabulations.
The tabulations appear to be proportional between the candidates.
Vermont was able to tabulate to the 95th percentile by November 10th.
There were no apparent audit transactions committed by Vermont by November 10th.
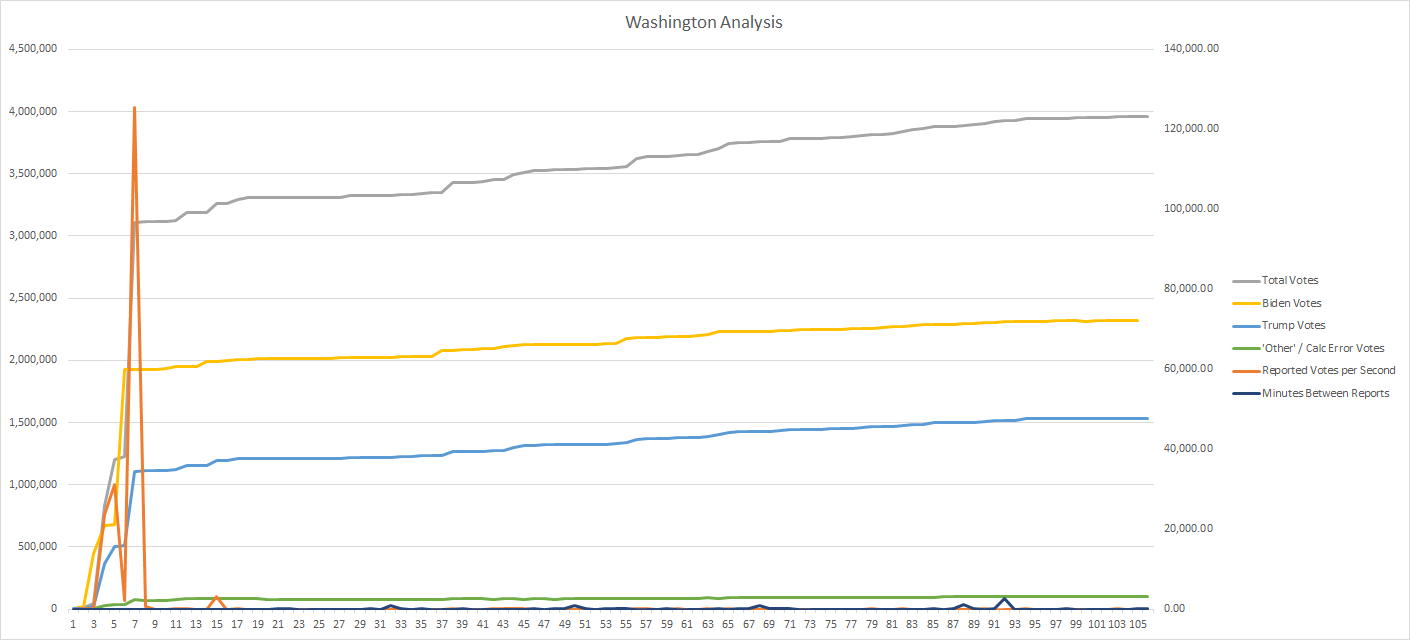
Washington featured the expected large tabulation rate spikes at the outset of the vote tabulation since Washington is another 100% mail-in / absentee voting state. Washington tabulated to the 82nd percentile in 7 tabulation reports.
The tabulations appear to be proportional between the candidates.
Washington was able to tabulate to the 97th percentile by November 10th.
Washington did not appear to commit any audit transactions by November 10th.
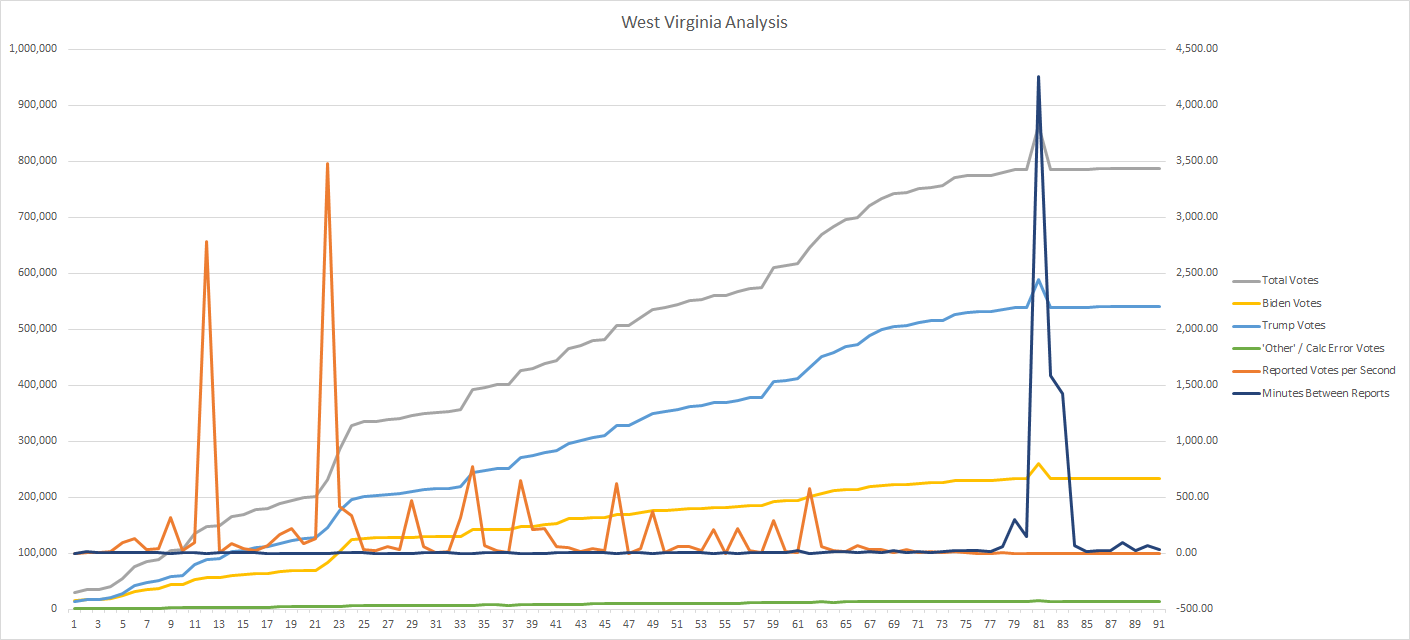
West Virginia featured steady tabulation rate reports with a couple of early spikes - those spikes not determinable whether they represented mal-in / absentee or relatively small tabulation reports.
The tabulations appear to be proportional between the candidates.
West Virginia was able to tabulate to the 99th percentile of the vote by November 10th.
There are some odd features to the ending of the tabulation reports. After a long delay of about 81 hours between November 4th and November 7th a relatively large tabulation report was posted on at 2:18 PM on November 7th. About 26 hours later, that tabulation appears to have been reversed on November 8th at 4:44 PM. The two transactions favored Biden by 33 votes, but the reverse transaction removed 23,621 votes from President Trump and affected 78,300 votes. Before November 10th, there were no other audit transactions. Since it involved a large number of votes, especially relative to the total, I’d like to hear an explanation for it.
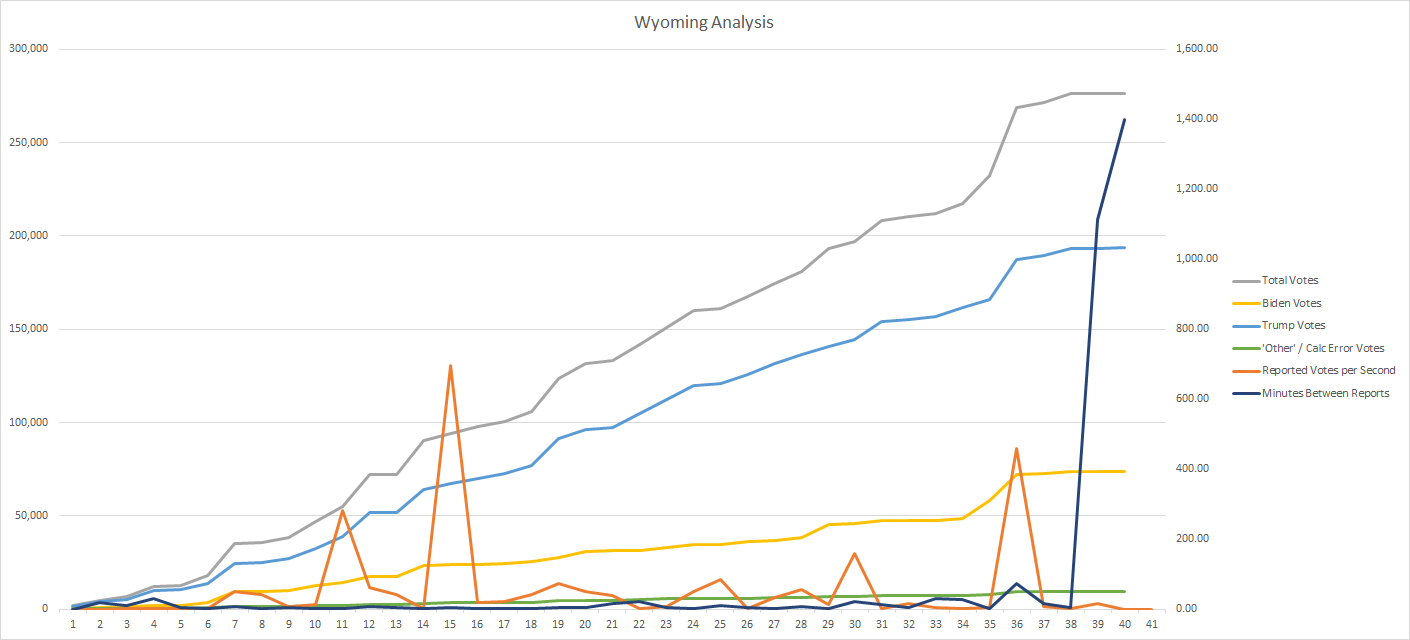
Wyoming featured tabulations in a bell curve with a large proportional tabulation near the end of tabulation. There was a long delay before the final two tabulations.
The tabulations appear to be proportional between the candidates.
Wyoming was able to tabulate to the 99th percentile by November 10th (its last report was on November 6th.)
It does not appear that Wyoming committed any audit transactions by November 10th.