When Math in Public is for the Republic
Want evidence about election fraud? Here's some. I'm tempted to call it proof.
Summary
In the US Presidential election, high level election officials (or persons impersonating them) in Pennsylvania, Virginia, and Minnesota appear to have committed election fraud by inserting vote audit transactions during early vote tabulation. Just from this evidence alone, the public can have no confidence in the election results in these states.
There’s strong evidence that substantial election fraud occurred in Georgia, Michigan, Minnesota, and Wisconsin with the sudden appearance of single tabulation reports with non-proportional vote allocations - unique to these states.
New Jersey features a single tabulation vote swap that results in a nearly 160,000 vote gain for Biden.
There are unusual time phenomena in Arizona and Nevada that deserve some attention.
In the past many days since the election, a number of people, using election data, have made various cases about voting irregularities, using Benford’s Law (re anomalous numbers), various statistical measures, and python (a computer language) scripts to demonstrate these anomalies. I think many of these efforts are useful. Some are not. In general, I don’t think that, by themselves, these kinds of analyses can persuade a court. Some could provide supplemental support. This post you are reading now is none of those things. It just uses simple arithmetic, some comparative analysis and nothing else and yet demonstrates significant election fraud. If you are interested in that, please keep reading. I hope to make it worth your while.
Doing math in public is fraught with peril. It should be undertaken with humility and great care. It’s with that intention that I have embarked on this effort. If there are any mistakes, they are my own and I will correct them and explain them.
In the voting process as well, election officials owe us proper, impeccable vote tabulations. If they provide incorrect or impossible numbers, and they don’t correct them or explain them, then they aren’t just making a calculation mistake. They are, rather, committing violence against the Republic.
In the recent election data, is there anything in plain sight that no one has noticed?
Let me set the table for a moment, and then we’ll get to it.
Data Provenance
A number of the people who have made assertions about election irregularities as referenced above have been using data sets that are found on the New York Times web site. The data in these files are produced by vote tabulation activities at precincts in counties in states and through some process of aggregation provided by a state to the company Edison Research that then transmits the data to the television networks and news outlets that subscribe to its data feeds. Part of that data provides time-stamped vote totals and the percentage relationship in those vote totals between the major party candidates.
Technical note: After OAN aired a segment and President Trump tweeted about it, the New York Times (among others like ABC) trotted out denials that Edison Research had anything to do with compiling a report about election irregularities. That’s true, but obfuscated. Edison Research doesn’t compile vote irregularity reports - what it does do, though, is supply the vote tabulation data as reported by the states in real time to virtually all television networks and news outlets - like the New York Times.
If you want to (as of the time of this writing, but there’s no telling how long this data will remain accessible), you can directly download that voting data by state from the New York Times web site. If you click on any of these links you will get a browser page that looks like so much gobbledygook. That’s because the data is in JSON format, a human readable, but intended for computer communication data stream.
(Like this for an excerpted example:
{"vote_shares":"bidenj":0.564,"trumpd":0.423},"votes":2023210,"eevp":45,"eevp_source":"edison","timestamp":"2020-11-04T02:30:41Z"}
)
The data for New Jersey is here: https://static01.nyt.com/elections-assets/2020/data/api/2020-11-03/race-page/new-jersey/president.json
For Pennsylvania: https://static01.nyt.com/elections-assets/2020/data/api/2020-11-03/race-page/pennsylvania/president.json
Etc. If you want the data for another particular state, just replace the name in the above url (using a dash in two word states) to get the data.
One group who were researching this data is here. On that page, one of the ‘Pedes’ created a python script that would take the JSON files in a computer folder and combine them into a .csv file. It’s that .csv file that I imported to Excel and on which I have based my analysis. I have personally verified enough of the original JSON files in comparison to this aggregate .csv file to determine that they contain the same data as of the last date of interest. Note that vote tabulation in states has continued to some extent beyond the date that the .csv was created (which was on November 10th). It would certainly be possible to update all of the JSON files and rerun the script, but I don’t think at this time that doing so would alter the results of my research (I may later change that opinion). I have supplied sufficient resources here for anyone that has an interest to recreate the data set that I have.
I will publish my full spreadsheet in the near future for anyone that has an interest in working with it themselves.
On Data Limitations
Some of my fellow conservatives who have opined on these data sets will not be happy with this section. We must let the math speak for itself.
The Edison election data stream is in an odd format. I’m guessing that this is the way that it is produced out of the state voting systems, but I don’t know for sure and am willing to be educated about that.
Each line in the state supplied data has only three numbers that are related to the vote tabulation: the total number of votes, the decimal percentage of that total that is for Trump, and the decimal percentage that is for Biden - and those usually don’t add up to 1. The number of votes for each candidate and remaining for third parties must be calculated.
The percent share of the vote for each candidate is expressed to three decimal places. What that means is that the data resolution is 0.1%. Whenever we do a calculation in terms of number of votes, we can be certain of the quantity only at the resolution of 0.1%. That means if the total votes are 1,000,000, the calculated accuracy resolution is 1,000. (i.e. .591 could actually be anywhere from .5905 to .591499999…)
So for those that have been claiming that when a calculated number of votes for Trump (relative to a previous calculation from the previous tabulation report) is a negative number - and that number is less than 0.1% of the total, it’s not likely the case (unless the overall vote total report is less than the previous tabulation). If you look at all these instances (negative relative calculations) over all the states, it is a fairly even distribution - with a distinct advantage to the ‘other’ (i.e. 3rd party) column, which is actually the remainder calculation to get to the vote total. These negative calculations, therefore in general, are not cumulative and can’t be used to ‘count up’ removed votes.
Of course, if we calculate negative numbers that exceed 0.1%, that’s very significant.
Aside: There are some who have been researching machine induced fraud (which I’m not addressing here) who propose that the vote ‘switching’ implementation is performed inside of this 0.1% tolerance. That’s certainly possible, but not provable with this level of data resolution. It’s possible that this is a nefarious reason that the vote tabulations are reported in the way they are now. For the future, such a strategy could be prevented by the states publishing the actual vote count by candidate. It could be argued that the present format is fairly compact, but just adding a 3rd party total field and replacing the percentage allocation with actual votes for the two party candidates would provide single vote data resolution. You could even remove the vote total field if compact data representation was the issue. Any manipulation of counts between tabulation reports could be readily detected.
There are also some who argue that there are common ratios between the candidates seen near the end of the tabulation reports and that demonstrates some kind of nefarious machine setting. It turns out that this is also a property of the 0.1% data resolution. Those long sequences of identical ratios also feature changes for each candidate between subsequent tabulation reports that are less than 0.1% combined. When the changes for one or the other candidates between reports change at a rate greater than 0.1%, the ratio changes. If the common ratios were not benign, we’d have to be as concerned about states like Florida and Texas and many others along with the the swing states that display identical ratios between tabulation reports.
So let’s get to it…
I have several areas of interest in analyzing this data. Part of the interest is vote tabulation and the relationship between the candidates in the tabulation. I also see these tabulations as a time domain measure and I’m interested in calculating time aspects as related to the tabulation reports. We can use the results of these calculations to do comparative analysis between states (that’s not statistical analysis - it’s “like or as” analysis.)
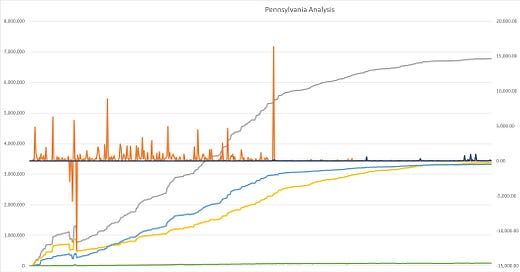
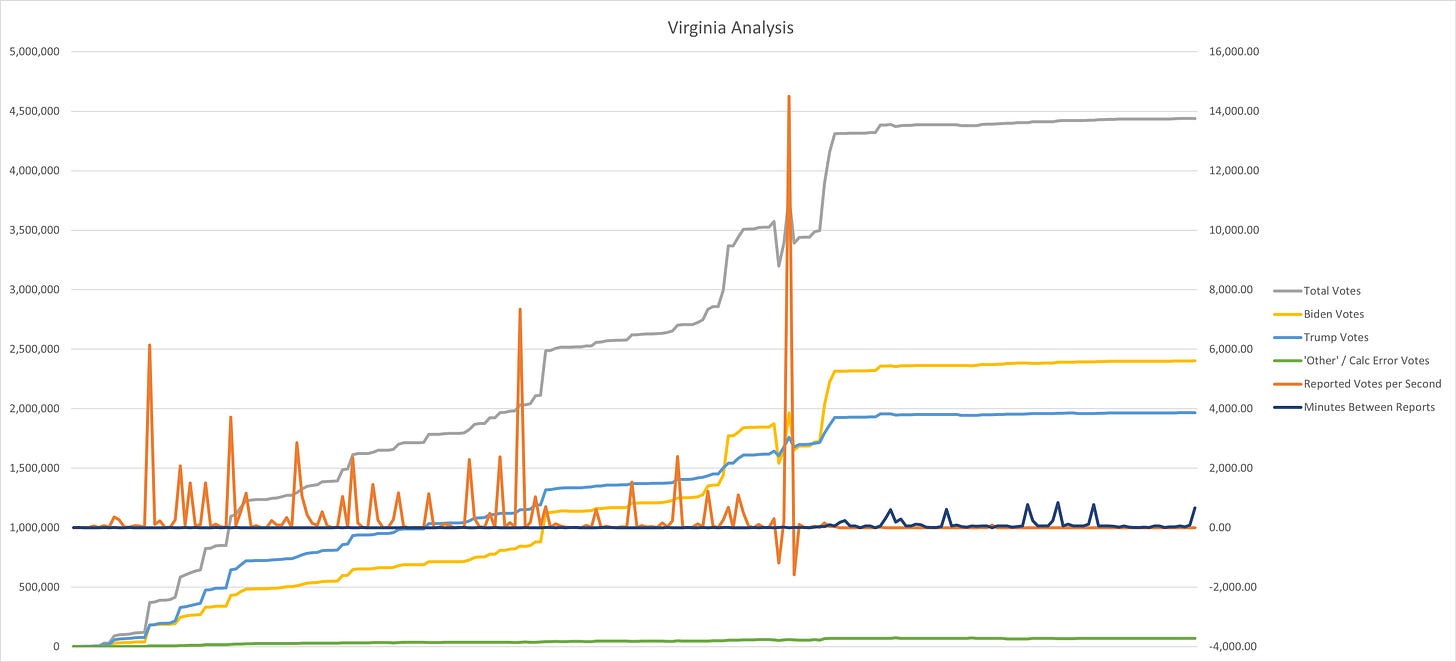
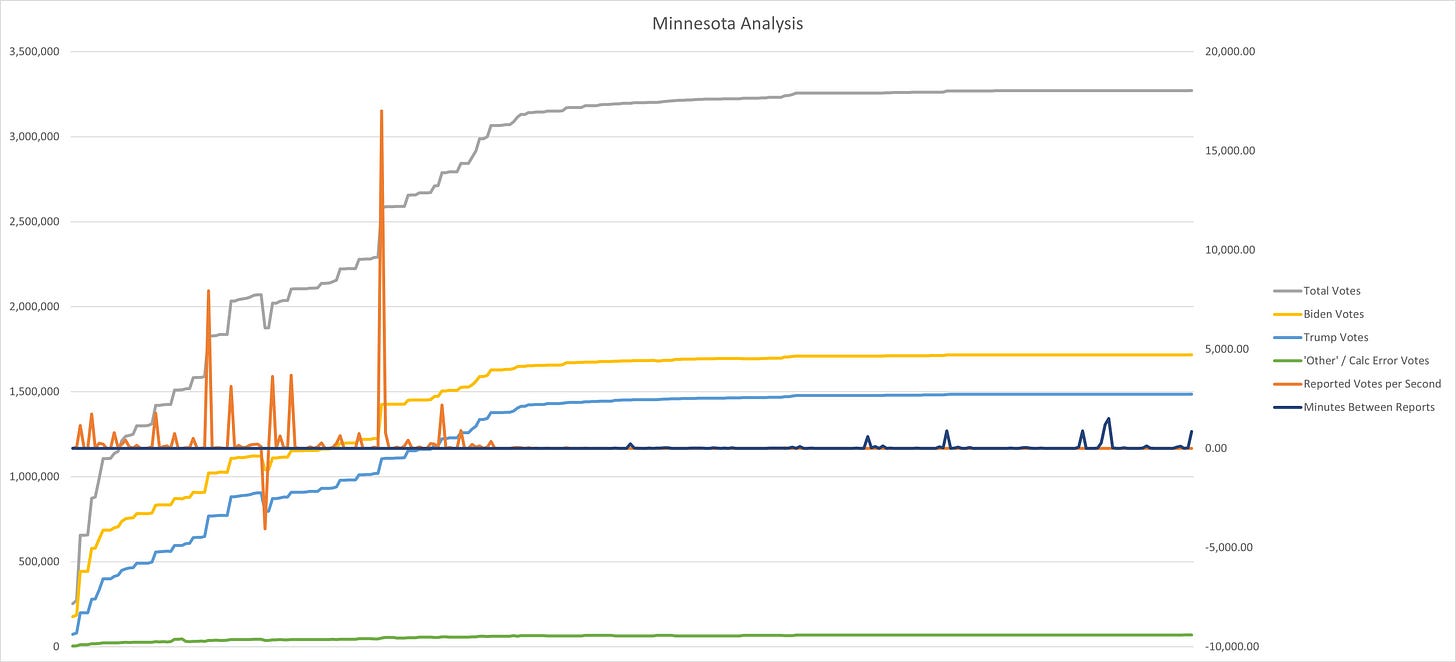
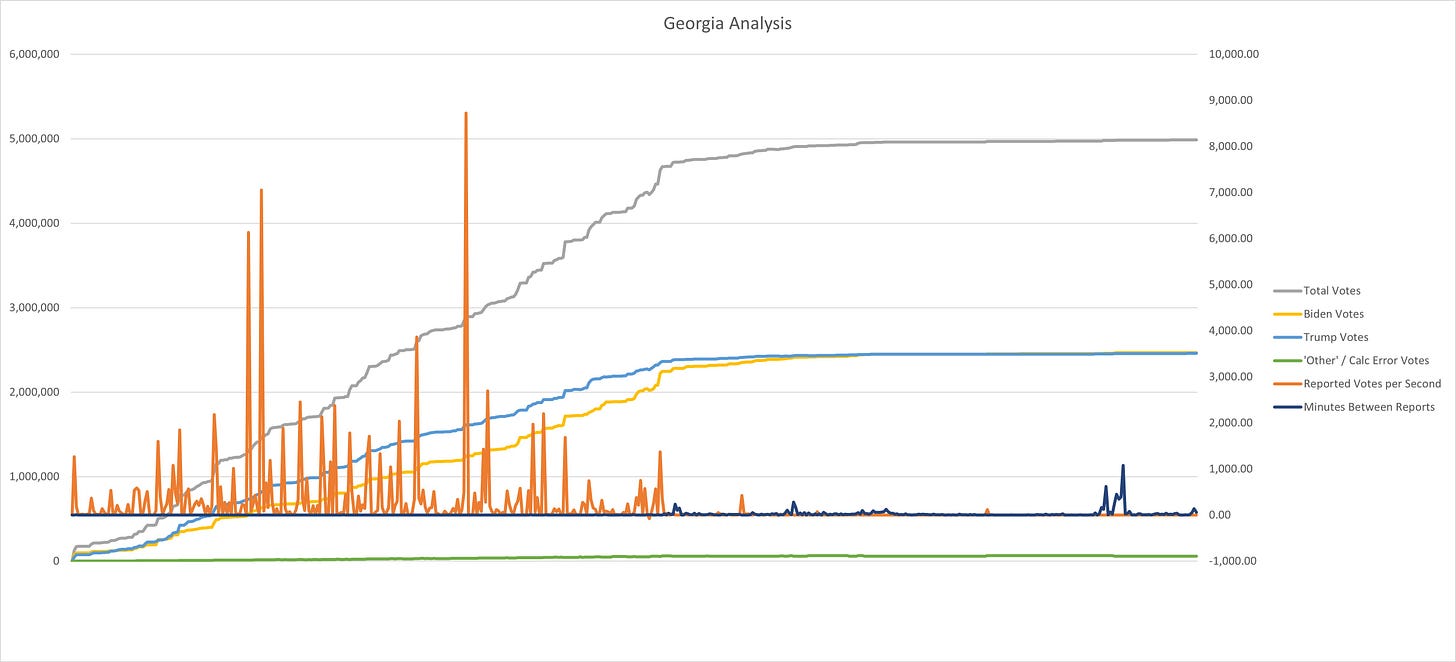
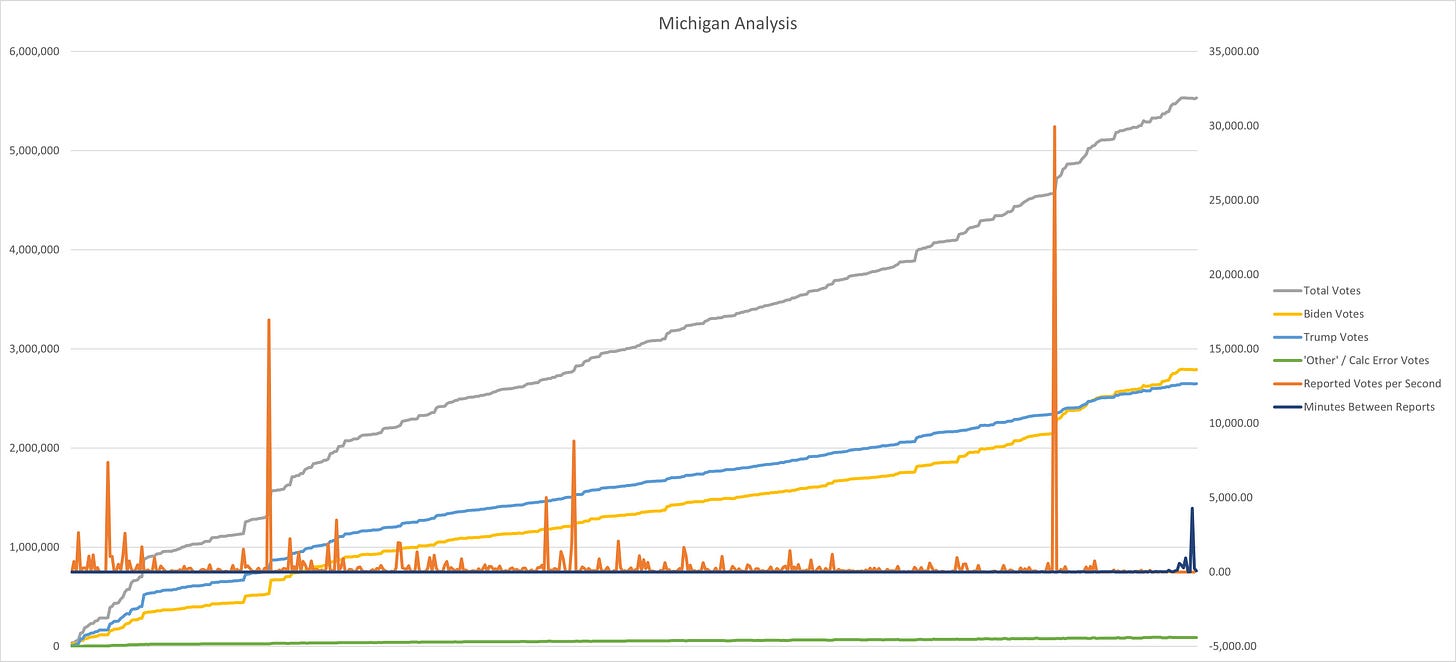
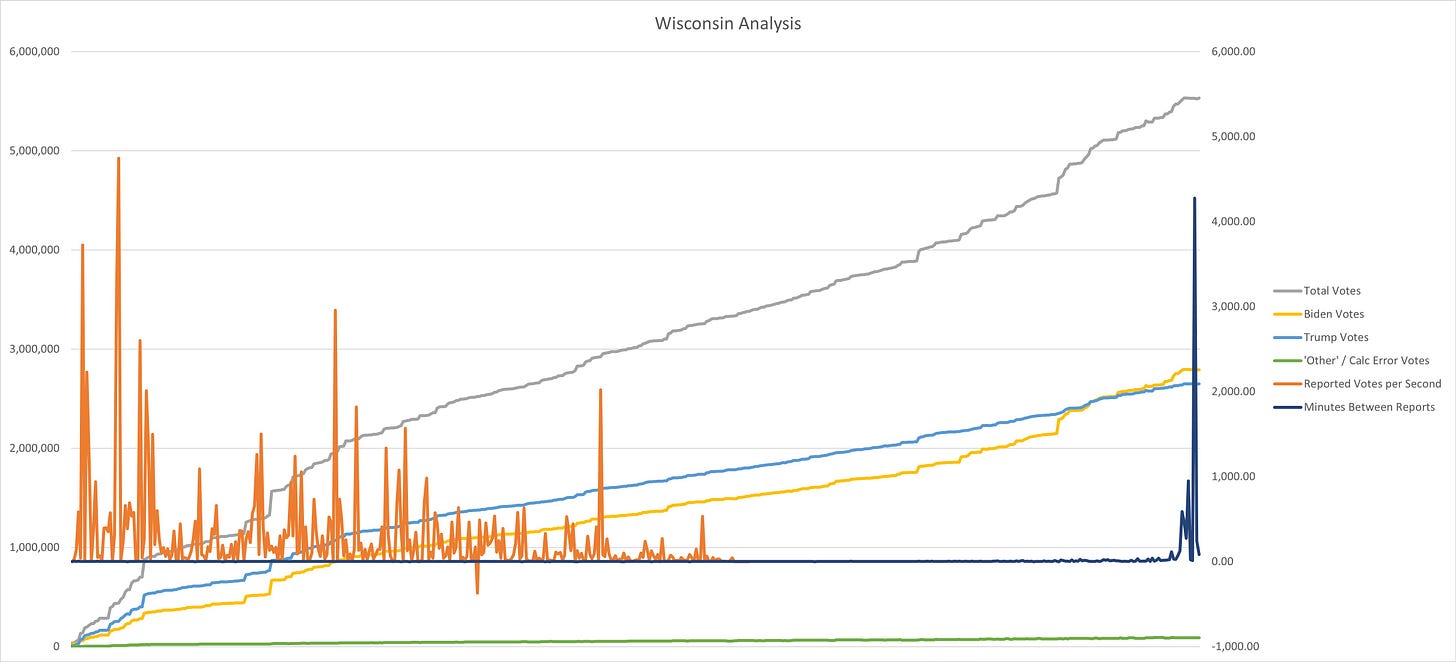
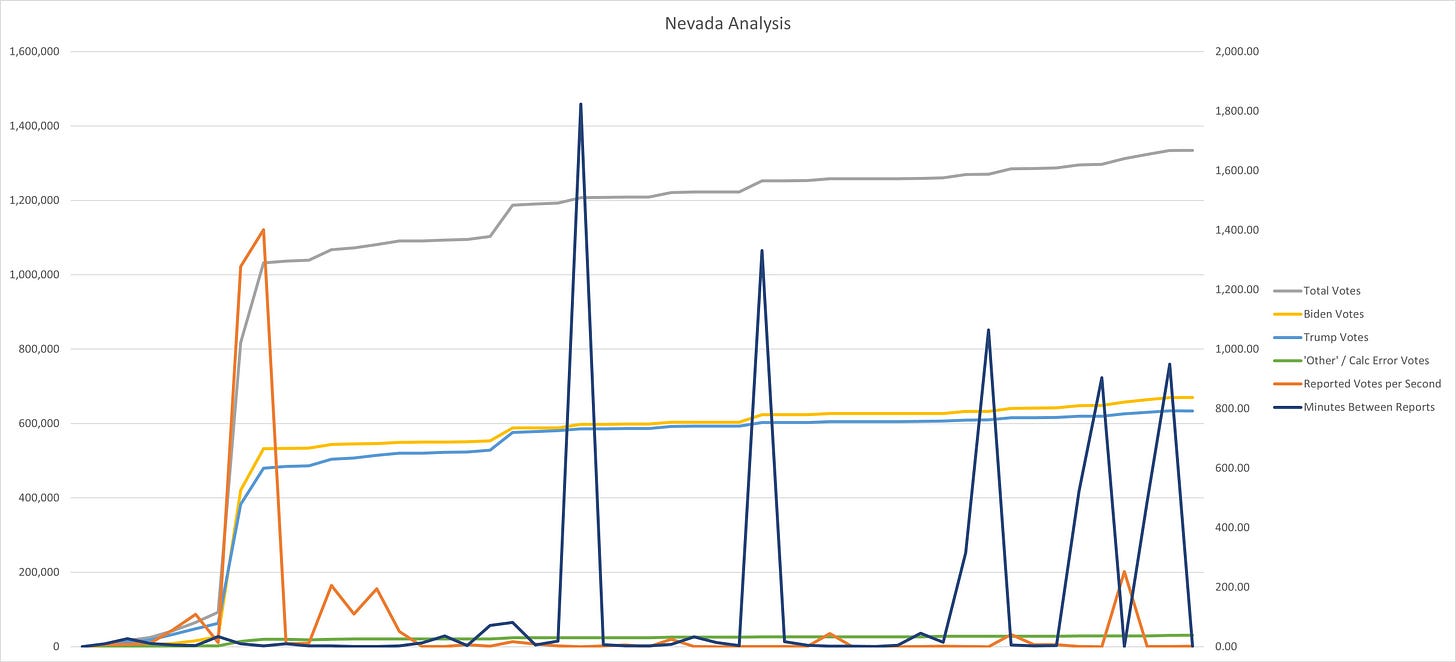
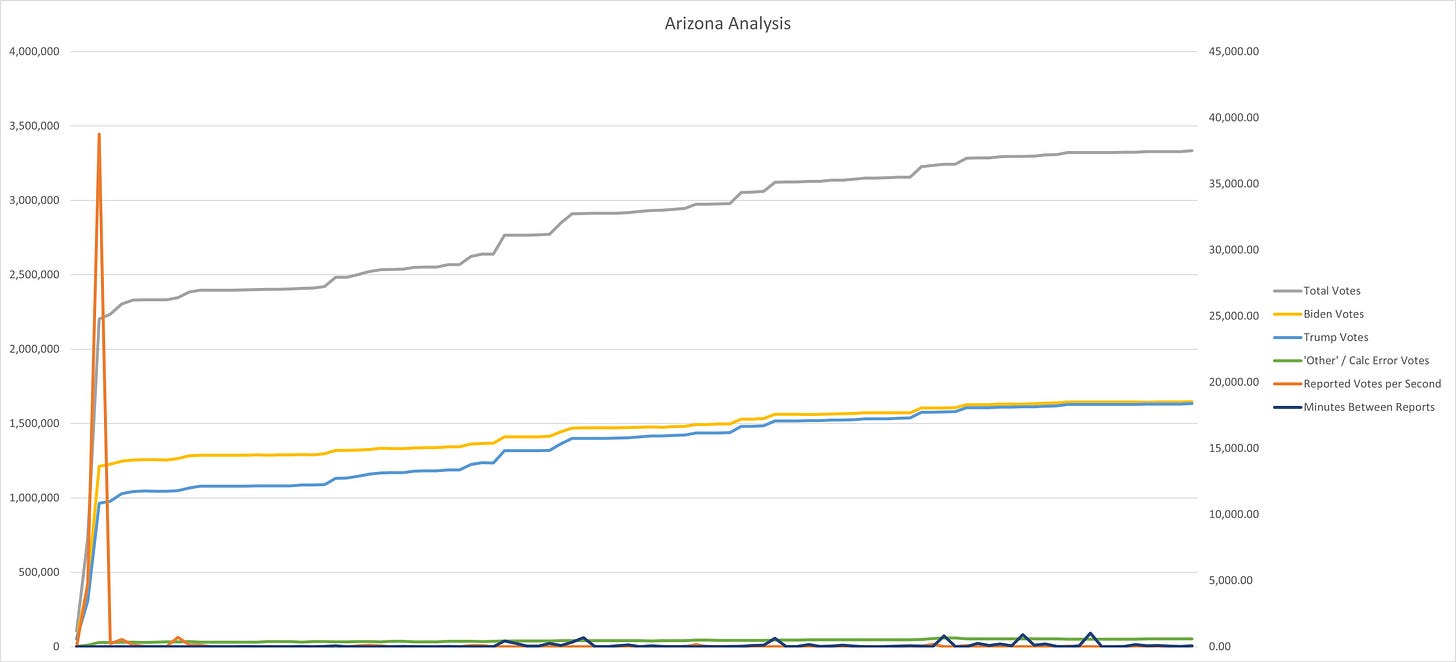
I’ve made a chart of every state over this election data. Each chart plots the total vote, the calculated President Trump vote, the calculated Biden vote, the calculated other / error vote, the Reported votes per second tabulated, and the Minutes between reports (see the Appendix for a definition of these fields).
In this initial post, I’ll look at the swing states and / or states that show some significant data issues to evaluate. In a separate post, I’ll analyze all of the rest of the states.
In the order which I think is most in the public interest:
Pennsylvania
The Pennsylvania state data provided by the Commonwealth of Pennsylvania to Edison Research and the media contains a bombshell.
If you were a journalist watching these numbers unfold in real time and you wanted to write a story about it, you could have created a headline that says:
8 minutes in Pennsylvania. How high ranking election officials in the early vote tabulation used vote audit transactions to appear to eliminate almost 80% of the tabulated vote and there’s no evidence that any of those votes were recanvassed.
And it would be apparently true.
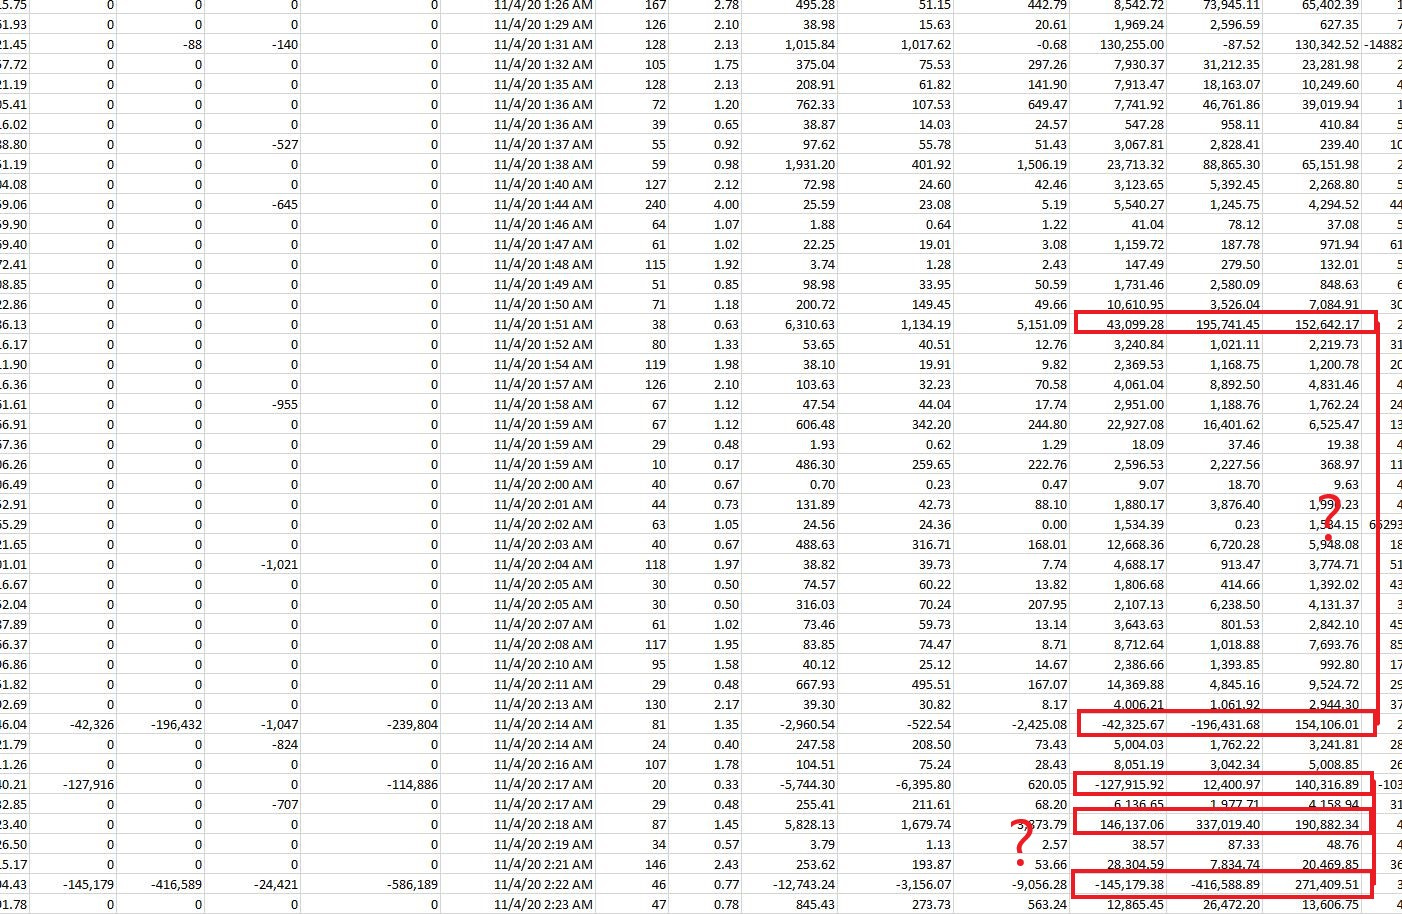
For clarity the columns depicted in the spreadsheet snapshot are: State, Time Stamp, Total Votes, Percentile of Vote Tabulated, President Trump decimal fraction of vote, Biden decimal fraction of vote (so far all columns supplied by State - Edison - NYT), Total President Trump vote (calculated), Total Biden vote (calculated), Total quantity of votes for both major party candidates (calculated), Other votes - third party candidates and / or computation error because of the 0.1% resolution, Votes ‘Removed’ for President Trump (calculated - subject to 0.1% interpretation), Votes ‘Removed’ for Biden (calculated - subject to 0.1% interpretation), Other / Third Party ‘Removed’ (calculated - subject to 0.1% interpretation), Over all ‘Removed’ total (calculated - subject to 0.1% interpretation), Time Stamp in Excel format (calculated). Note: Additional columns not shown in this snapshot. See Appendix for all column definitions.
See that big splash of negative numbers across the spreadsheet? And just below in the chart for Pennsylvania - sudden negative spikes in vote tabulation. Three lines appear to remove a total 940,879 ballots from the totals. And it looks quite unfortunate for Joe Biden.
Plotting the vote numbers makes for a very strange looking chart. What do these numbers mean? How did they get there?
The basic answer is that these numbers aren’t voting tabulations at all - after all negative ballots are a physical impossibility. They are actually audit transactions performed by someone with the access and authority to make them. I would think that that person or those people can be readily identified.
Let’s consider audit transactions in the context of live voting operations. Once we look at all the vote tabulations of these states, we will see a number of these states employ audit transactions near the end of tabulation reports and usually they are relatively small numbers (not always as we will see with New York, for example). They represent the ‘found’ errors in tabulations over the course of the state’s canvassing operation.
But why would someone implement massive audit transactions at about the time that 16 percent or so of the state’s votes have been tabulated? It seems an extraordinary decision. It would be like an accounting auditing firm committing journal entries to close a month end for a company - near the beginning of the month. What was it? Panic? Hubris? Both? Incompetence?
Let’s look at additional calculations in the spreadsheet to see what may have transpired.
For clarity, additional columns not show in previous spreadsheet snapshot are: Seconds between tabulations (calculated), minutes between tabulations (calculated), Votes per second between tabulations (calculated), President Trump votes per second between tabulations (calculated), Biden votes per second between tabulations (calculated), President Trump vote difference between current tabulation and prior tabulation (calculated), Biden vote difference between current tabulation and prior tabulation (calculated), absolute value difference between President Trump and Biden between current tabulation and prior tabulation (calculated). All spreadsheet columns are defined in the Appendix.
It seems pretty apparent that the first audit commit was to reverse a tabulation report submitted at 1:51 AM. That audit transaction is pretty much a wash - since the numbers aren’t exact (perhaps there are other tabulations spilling into these reports, which creates other implications to consider) so we will just assume that it’s a wash. The next transaction is puzzling. Is it an attempt to correct the situation? Or is it intended to audit out another prior tabulation report (there is another tabulation report at 1:31 AM that has about 130k votes in President Trump’s column, but it’s well out of balance with this transaction.)
Next we come to what now is obviously another audit transaction - this one in the positive rather than the negative direction which is why we don’t see it in the ‘negative’ calculations - and it appears to be designed to cure the previous one in some way. It reminds me of seeing inexperienced people attempting to make general journal entries - it’s often difficult to post the correct numbers in the credit and debit sides of the transaction because it’s often nonintuitive. It seems to create the opposite of the intended effect. Because, after this one, we then see another huge negative audit transaction that’s another attempt to clean all of this up. All of this occurred in 8 minutes.
Aside: We might ask, why are these transactions not identical numbers - i.e. balanced transactions. The first possible explanation is the 0.1% resolution issue. If the delta between transaction sides is within 0.1%, then it’s within the margin of compute resolution. If the transactions are outside of that, then I think the answer could be that the vote tabulations for some states seem to be actual streaming - at least partly an automatic flow of data from the tabulation machines to the data provider - in addition to some kind of batch operations - like we’ve been hearing about USB cards that hold tabulation data. The persons doing audit adjustments are most likely submitting balanced transactions, but data aggregation is modifying those numbers (in the cases we are contemplating outside the 0.1% resolution) before being submitted to the provider. This seems to suggest that not all of these tabulation systems are “air gapped” (which means compute devices that are NOT connected to any kind of communication or network environment.) In many state jurisdictions having network connected vote tabulation systems is illegal.
The main thing to remember here is that none of those numbers in those red boxes (except for possibly some amount recorded in the very first one) are actually tabulated votes. (Though they significantly impact the reported vote total for the state.) They are artificially introduced numerical audit transactions initiated by a person or persons (or some person or persons who have obtained their credentials) at some very high level of election authority. What other explanation could there be?
I have a theory about this particular set of transactions. It’s just speculation. I think the decision to do the audit transactions was driven by an entry error on the first report they wanted to reverse. Instead of 43,099.28 in President Trump’s column, perhaps it should have been 143,099.28. If the decision to commit an audit transaction was done to correct that error, all that they would need to do would be to commit a transaction adding 100,000 to Trump’s total. But, perhaps the optics weren’t appealing to do that so these other attempts were made. I offer this conjecture mainly because on President Trump’s side of the later audit transactions, the number 146,137 appears as President Trump’s side of the journal entry - which given the variation in the other audit transactions is pretty close to 143,099 and inside the margin of calculation resolution.
If that were the case, if we call the first transaction a wash, then we have 140,316 net for Biden plus 190,882 net for Biden, minus 271,409 net for President Trump in the next three transactions, which is a net Biden of 59,789 votes inappropriately in his total just because of the audit transactions plus the 100,000 for President Trump that was the intention of the correction in the first place. That could mean that President Trump’s current total could have been transacted out by the externally applied audit transactions to the tune of 159,789 votes. That alone exceeds the current difference in the final total. (If there were no 100,000 votes due to President Trump, this string of audit transactions still favors Biden by the 59,789 votes - all while reducing the reported vote total.)
Could there be some other explanation? Perhaps a benign explanation? I can’t think of a simple one. At best it seems to evince a callous disregard for the sacred franchise of the vote. Only the person or persons that did this can explain what their objectives were. They should be compelled to do so.
Once someone makes a decision to insert audit transactions in a live vote stream, it begs the question whether any number of what are apparently subsequent (or even prior) vote tabulation reports have been altered externally.
Alternatively, it could also be the case that these audit transactions were purposely intended to reduce the total votes in the ongoing tabulation reports. What if someone had advance information as to what the total vote was going to be? It might not look right to have a certain voter turnout level. This, of course, attributes bad intent for making these audit transactions - but their existence is evidence that bad intent in these reports already exists.
Oh, and if that weren’t enough. We’ve heard about vote swapping from various sources and have been assured by the media that there is no evidence that it occurs. Well, it happened in Pennsylvania at a level that we can detect. From the vote data on November 4th at 4:08 AM.
Note the column designations from the first spreadsheet snapshot.
The vote total didn’t change much - from 2,984,468 to 2,984,522. But 17,877 votes from one vote tabulation report to the next (which is significantly larger than the 0.1% accuracy resolution) were removed from President Trump’s total and 17,929 were added to Biden’s total for a net Biden gain of 35,806 votes. (Perhaps the 52 votes in the delta were actually tabulated, but we can’t discover that here.)
From the 1st to the 80th percentile, President Trump won the vote at a ratio just above 119% in 305 tabulation reports for a lead of just over 494,000 votes. From the 80th percentile to the 98th percentile in 235 tabulation reports (which is a long tabulation report tail), Biden won at a ratio of about 302% to take the lead in vote tabulation. No other state features that kind of turnaround in vote ratio.
Virginia
From the election results published to date, it doesn’t appear as if Virginia is in play.
But, they are another state where someone with audit access to the election system there committed a series of audit transactions during live vote tabulation.
What do the vote tabulation reports say?
Note the column designations from the first spreadsheet snapshot.
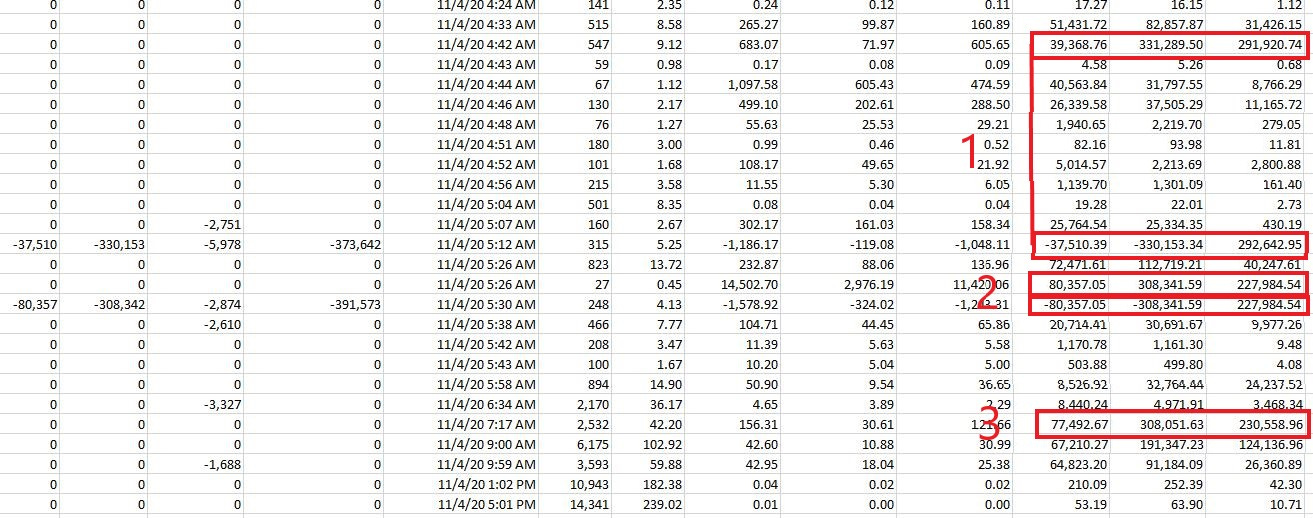
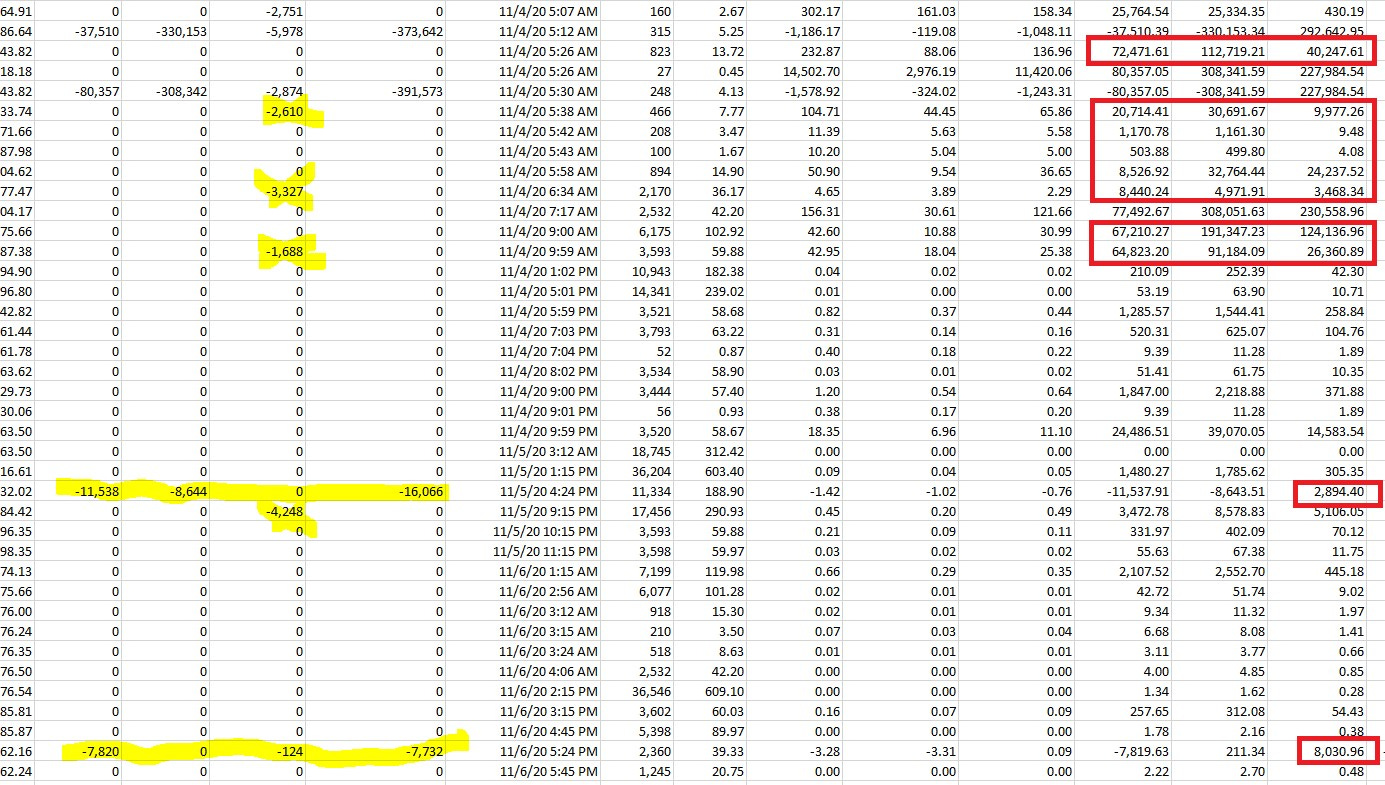
What we can see in terms of the negative transactions is that on November 4th at 5:12 AM 37,510 votes were removed from President Trump and 330,153 votes were removed from Biden, along with 5,978 which (larger than the 0.1% data resolution requirement) were removed from the 3rd party votes. Then at 5:30 AM (just 18 minutes later) 80,357 votes were removed from President Trump and 308,342 were removed from Biden. (The votes removed from 3rd party votes are within the margin of data resolution so could just be a compute error.) Once again, it doesn’t look good for Biden.
Of course, negative votes are physically impossible. Given that we can’t directly compute plus side audit transactions (Which is why this could be so insidious. If even one plus side audit transaction can be proven, just how many could there be?), what has transpired during this time period that can give us clues?
Note the column designations from the second spreadsheet snapshot above.
It appears that the first audit transaction was intended to reverse the tabulation report that occurred at 4:42 AM. Then the transaction shortly subsequent to that reversal seems to reinstate it with a different value for President Trump’s votes. Then that transaction is immediately and identically reversed. A few reports later a new audit transaction - or perhaps a new tabulation report - adds it back in again.
So how do we interpret this scenario? Voting tabulation is taking place and the tabulation report is posted at 4:42 AM. At 5:12 AM some high ranking election official with audit power makes the determination: something has happened that is so egregious, so threatening to this election that we must intervene and issue a reverse of that transaction while we are at 75% of the vote tabulation - and they do so. At 5:26 AM it appears that they issue an audit transaction that is the correction to the original one. Less than 5 minutes later they determine - no that’s not the right one so we’ll reverse that one. They then either direct the county or precinct to resubmit the tabulation report or they execute another audit transaction which occurs at 7:17 AM, not quite two hours later.
Well, you might think, they basically just just corrected the original tabulation and are essentially saying that President Trump was shorted about 60,000 votes. No harm, no foul, right?
How about we take on a speculative forensic examination, then, ok?
You see, there are a couple more, much smaller negative audit adjustments that show up later - and they’re in the correct percentile of the count reported (at the 99 percentile of the vote) for doing audit transactions. But it’s quite difficult to see what they might be tied to or “correcting”.
Note the column designations from the second spreadsheet snapshot above.
What I’m considering as those later audit transactions are highlighted in yellow on the left side of the spreadsheet snapshot. (Not the yellow '‘X’s” - those are computations that fall within the 01.% calculation resolution, so we don’t know if they have any meaning here).
Now, let’s just consider a set of numbers - for now only the numbers that are in the top right hand corner red boxes. These are the tabulation reports that occurred just after the original reversal audit transaction, but don’t include the other large audit transactions. If you add up the ‘middle’ column in the red boxes, (112,719+30,691+1,161+499+32,764+4,971+191,347+91,184) you obtain (with rounding) 465,340. If you add up the ‘left’ column in the red boxes, (72,471+20,714+1,170+503+8,526+8,440+67,210+64,823), you obtain (with rounding) 243,861.
Now, without changing any numbers, see if you can select some numbers from each column to subtract from that column’s total to see if we can obtain a familiar pair of numbers. From the ‘left’ column using (20,714+1,170+503+8,526+67,210+64,823), you obtain 162,949 (with rounding). From the ‘middle’ column (using 112,791+32,764) - hmmm, that doesn’t get us there… Oh, how about those pesky later audit transactions? Ok, (using 112,791+32,764+2,894+8,030) you obtain 156,409 (with rounding). 465,340-156,409 is 308,931. 243,861 - 162,949 is 82,083 (with rounding). 308,931 and 82,083 are both within the 0.1% margin of the second “correcting” audit transactions.
This makes it possible that there was a design among these tabulation reports (all so near to the larger audit transactions) actually executed as audit transactions themselves to effectively double count the large Biden margin transaction that these series of audit transactions seemed to correct. That might also mean that this kind of fraud vector created a target for ballot count management to that ballots could later match up to these records. Or it is possible that those 308+K and 82+K votes were physically counted twice along with some other ballots.
Whoa, just a minute you say. Sure, there’s some legerdemain addition here with these vote totals, but obtaining these numbers is just coincidence. Besides - what you are proposing would require a high ranking election official or officials to be willing to create audit transactions against a live vote tally… Oh, wait!
If the big margin tabulation is fraudulent, and / or the double count is fraudulent their combination could exceed the Biden margin of victory. In Virginia.
Such is the slippery slope.
Minnesota
Minnesota is a kind of hybrid state in the context of this analysis.
It’s another state whose election officials are willing to execute audit transactions in the middle of live vote tabulation.
We also examine the abrupt appearance of votes after exceeding the 60th percentile of vote tabulation.
There appears to be a single negative values audit transaction in Minnesota.
Note the column designations from the first spreadsheet snapshot above.
On November 4th at 4:38 AM an audit transaction was committed that removed 107,633 votes from President Trump and removed 81,125 from Biden.
Note the column designations from the second spreadsheet snapshot above.
It appears that there is no correcting audit transaction related to this initial transaction which results in the elimination of a net 26,447 votes for President Trump.
If this indeed is the case, then 194,846 voters in Minnesota were disenfranchised by that single audit transaction.
On November 4th at 5:30 AM a tabulation report was posted at the 67% completion of vote tabulation in which Biden was credited with 198,565 votes and President Trump was credited with 84,809 votes. Much has been made of these figures in a number of works of analysis especially from a statistical standpoint. In this post I will examine only comparative characteristics within Minnesota and as compared to other states.
For almost all incremental increases between one tabulation report and the next for all states, there is a proportional increase in the opponent’s tabulation count. In this exemplar in Minnesota, that’s somewhat true as well. It’s a larger increase proportionally on Biden’s behalf than almost all in Minnesota at a ratio of 234% - only exceeded in the initial mail-in ballot tabulation (i.e. the first tabulation for the state) at 245% (excluding small tabulations of less than 5,000 votes difference). Large vote tabulations like this are also rare around or above the 70% completion of vote tabulation. Comparatively, the most surprising in-state characteristic is the percent increase of this single tabulation report over the Biden vote total prior to that tabulation. From the 54 percentile completion of the vote tabulation through this single large tabulation, the average Biden increase per tabulation was 0.384%. This single tabulation was an increase of 13.94% for Biden over ALL previous Biden votes for the state. This is a 3,632% percent increase over the average. Or more than 36 times the incremental average for the previous 45 tabulations. There are three other states - Georgia, Michigan, and Wisconsin - that all had very large single tabulation reports and each of those without proportionality from President Trump’s votes, but Minnesota features a larger increase in percent for the single large tabulation for Biden than those three states. California, for example, also had a very large single tabulation at nearly 80% of vote tabulation completion, but proportionally the Trump increase was a greater percentage than the Biden increase to their respective totals.
Could this tabulation have involved a positive audit transaction? Given that there is a massive audit transaction in the midst of the vote tabulation, it can’t be ruled out. However, there does not appear to be a way to demonstrate it like there is in Pennsylvania and Virginia.
Georgia
Now we move to a class of occurrences that involve the sudden appearance of large numbers in a vote tabulation event without proportionality from the opponent’s vote.
Georgia’s initial tabulation graph looks normal - much like the other states without issues. It has a bell curve of vote tabulation rate with proportional increases between the opponents.
But the difference between the vote curves is significantly altered with a single tabulation that features an incremental percentage increase of 6.131% for Biden relative to all of his previous votes. This was at the 90th percentile of the completion of vote tabulation. The incremental increase was 1,087% or almost 11 times the average incremental increase from the 50th percentile to the 90th percentile. And the Biden to Trump ratio for that single update was 468%. That ratio was only exceeded six times in the entire tabulation for the state - and all of those at much smaller quantities.
In addition, from the first percentile of vote tabulation to the 82nd percentile of tabulation completion President Trump led by about a 115% ratio which amounted to a lead of just over 288,000 votes. From the 82nd percentile to the 92nd percentile Biden won at a ratio of 224% and gained over 215,000 votes. From the 92nd percentile to the 99th percentile Biden won at a ratio of nearly 240% and gained over 80,000 votes to take a lead in the vote tabulation. No other state matches this massive ratio turn-around except for Pennsylvania.
Georgia has another characteristic shared with Pennsylvania - a very long tabulation report tail. Georgia reached the 99th percentile of vote tabulation early in the morning on November 6th. It subsequently provided 203 (I hand counted from the most recent report) additional tabulation reports all within the 99th percentile of the vote tabulation - or about 36% of its total tabulation reports. Out of those 203 additional tabulation reports, 3 of them awarded a total of about 15,000 votes to Biden. Most of the rest were virtually tied.
Michigan
Like Georgia, Michigan exhibited a pretty normal looking beginning to its vote tabulation process with the possible exception that its tabulation reporting seems more frequent than most other states - i.e. the incremental movement between tabulations for the most part (except for very early on) didn’t exhibit large counts.
At the 83rd percentile of the vote tabulation, there was a single tabulation that gave Biden 141,258 votes and President Trump 5,968 votes - an almost complete absence of proportionality. This was a ratio of 2,367% in favor of Biden. No other tabulation ratio for Michigan was even close. That tabulation gave Biden a percentage increase over his prior vote total of 6.17%, a 2,481% increase - or almost 25 times - over his average vote increase percentage from the 50th percentile to the 83rd percentile. That single vote tabulation also created a huge spike in the votes per second count rate. While we do not know when this tranche of votes were specifically tabulated, the spike near the end of the vote, well outside the overall bell curve suggests either a long period of counting - without reporting any tabulation during that counting, or a positive audit transaction for the purpose of creating a target vote count. There’s no other evidence of substantial audit transactions in Michigan’s vote tabulation prior to nearing the end of tabulation. There are three relatively small negative audit transactions visible - one at the 94th percentile, and two at the 99th percentile of the vote tabulation that altered about 21,000 votes - but with a very small delta between President Trump and Biden.
From the 1st percentile to the 80th percentile President Trump led by about a 109.6% ratio in 451 tabulation reports for a lead of just over 200,000 votes. From the 80th percentile to the 99th percentile at the virtual completion of the vote, Biden won at a ratio of 205% of the vote in just 79 tabulation reports to take the lead.
Wisconsin
Wisconsin also features a single tabulation without proportionality from the opponent.
In early tabulation, Wisconsin’s chart looks pretty normal as compares to other states that don’t exhibit irregularities. It is readily apparent that there was early counting of absentee / mail-in ballots
But at the 89th percentile of the tabulation as single very non-proportional tabulation report gave 143,379 votes to Biden and 25,163 votes to President Trump. This single tabulation alone flipped the state in favor of Biden. This tabulation ratio for Biden was 570% - surpassed only once in the entire set of tabulation report in Wisconsin (and that was on a 3,500 vote total tabulation report). It was (again at an 89 percentile reporting) an incremental percent increase over all the previous tabulation totals for Biden of 9.13% which is 3,274% or almost 33 times the average increase in Biden tabulation reports from the 50th to the 89th percentile - 194 tabulation reports. In this way, it is much alike Michigan and Georgia, but very unlike most of the other states who saw no massive spikes in single tabulation reports and extremely high incremental increases over total votes for a candidate.
New Jersey
More vote switching between candidates. Main stream media would have you believe that there are no exemplars of this occurring anywhere in the election. Well, here’s another one.
From the state reported data voting tabulation stream- on November 4th at 3:25 AM 79,568 votes were removed from President Trump and added to the total of Joe Biden. The overall vote total did not change. Perhaps the key question here is: Who thought Biden would need 159,137 extra votes - in New Jersey?
It appears the New Jersey had a significant amount of absentee / mail-in ballots and likely pre-tabulated a good portion of them. That’s why there’s an apparent high rate of counting at the beginning of the tabulation reporting.
By November 10th, New Jersey had counted approximately 86% of its vote which would put it near the bottom in total vote percentage tabulated.
Nevada
Nevada did not apparently feature any audit transactions or single vote tabulations that were not proportional.
But Nevada is characterized by a particular feature that makes it unique among all 50 states. It features massive delays between some tabulations. The first one was over thirty and a half hours from a previous tabulation at 10:45 AM on November 4th. This was followed by four more substantial tabulation delays from fifteen to twenty two hours. In the tabulations that followed from the initial delay, only two allocated more votes to President Trump in the tabulation posted. Nevada made a total of 52 vote tabulations from election day to November the 10th. That’s about 10% of the number of tabulations made by the states with the most tabulations during the same time period.
No apparent negative audit transactions were posted in Nevada. But with the amount of time available between tabulations, there was enough time to do almost anything.
Arizona
It’s clear that Arizona pre-counted at least a substantial portion of the mail-in / absentee ballots. Otherwise, it seems to proceed in normal fashion with proportional increased per tabulation between the candidates.
By the third tabulation update, they had tabulated to the 69th percentile of the vote. Somewhat like Nevada, there are substantial delays in tabulation starting in the middle of the tabulation reports. These delays vary from seven hours to twenty two hours prior to November 10th. The normal process evidenced by most of the states is very little delay between tabulations until, perhaps, the last few tabulations when election efforts are dedicated to completion of the total tabulation.
Conclusions
There is direct evidence that people with access to the highest levels of vote tabulation software - specifically the ability to issue audit transactions - did so in Pennsylvania, Virginia, and Minnesota. Once audit transactions have been committed in the middle of the vote tabulation, there is the possibility that many other, undetectable positive audit transactions have been committed. Those who performed these callous acts should be called to account and the audit trail of those state’s voting systems should be sequestered and investigated to determine how widespread these actions were. A case could be made that these particular elections should be nullified because of these callous acts. They are the actors that caused widespread disenfranchisement.
In Georgia, Michigan, and Wisconsin, almost identical single vote tabulations with enormous, non-proportional vote allocations in favor of Biden occurred very late in the tabulation process exhibiting enormous vote ratio differences and incremental vote increase percentages not seen in almost all of the other states (with the exception of some of the others examined in this post). In this way, they are very like each other - but unlike almost all other states that exhibited proportionality for almost every vote tabulation report. Though it doesn’t prove it, these characteristics demonstrate the likelihood of fraud. Circumstantial evidence, along with eyewitness evidence is often utilized in the courts by the tryers of fact.
Nevada and Arizona exhibited long delays during tabulation which does not characterize almost all of the other states.
My next post will present the remaining charts with a little commentary about the other 41 states. There are a number of interesting characteristics to observe that distinguishes most of the states from these apparent bad actors.
Aside: I was an early support and contributor to Matt Braynard’s data wrangling team (note - they are no longer raising money as the project is basically complete, but it’s a good place to review the objectives and results.) They bought very large state voter databases and government databases and crossed referenced various voter characteristics against them. They then followed up with a massive phone campaign to get a reasonable sampling of voters to determine whether there were fraudulent actions by some states and by some voters in those states. One of the most significant finds his team made was to identify - down to name and address details more than 20,000 people who voted from out of state illegally in the state of Georgia. They also identified thousands of ‘voters’ in Georgia that provided addresses that are thinly disguised post office or commercial addresses (which is illegal in Georgia). This team also identified all kinds of irregularities in other states. I think that it is these kinds of things that support legal actions that make a difference. The illegal out of state Georgia voters could flip that state alone.
Appendix
Spreadsheet Layout and Calculations
The .csv file provides this information on each line: State, Time Stamp, Vote Total, EEVP (what would be called “Precincts Reporting” on the television), The decimal fraction of President Trump votes, and the decimal fraction of Biden votes.
I have added the following fields (columns) in the resulting spreadsheet: Trump votes (calculated), Biden votes (calculated), Total Check (the total calculated Trump and Biden votes), Other (this would be 3rd party candidates / a placeholder for any calculation error between Trump and Biden calculated votes), Trump votes ‘removed’ (calculated), Biden votes ‘removed’ (calculated), Other ‘removed’ (calculated), Net Running Removed (a total of calculated ‘removed’ votes by calculation), Date Stamp as Excel date time (conversion of the text date stamp supplied), Seconds (the calculated number of seconds between vote report time stamps), Minutes (the calculated number of minutes of same), Votes / Second Rate (calculated), Trump votes / second (calculated), Biden votes / second (calculated), Trump Delta (calculated), Biden Delta (calculated), Absolute difference between Trump and Biden (calculated), Trump / Biden Ratio percent per line (calculated), Biden / Trump Ratio percent per line (calculated), Trump incremental increase percent per tabulation report (calculated), Biden incremental increase percent per tabulation report (calculated).
Definitions
Trump Votes - Total votes (supplied) * numerical decimal value of Trump votes (supplied) - accurate to 0.1%
Biden Votes - Total votes (supplied) * numerical decimal value of Biden votes (supplied) - accurate to 0.1%
Total Check - Trump votes (calculated) + Biden votes (calculated)
Other - Total votes (supplied) - Total Check (calculated)
Trump votes ‘removed’ - Trump votes of current tabulation report (calculated) - Trump votes of previous tabulation report (calculated), IF negative
Biden votes ‘removed’ - Biden votes of current tabulation report (calculated) - Biden votes of previous tabulation report (calculated), IF negative
Other votes ‘removed’ - Other votes of current tabulation report (calculated) - Other votes of previous tabulation report (calculated), IF negative
Net Running Total ‘removed’ - Trump ‘removed’ + Biden ‘removed’ + Other ‘removed’
Date Stamp as Excel date time - parsed value of Time Stamp (supplied) formatted as Excel data time field. Note that Excel’s resolution for chart plotting is apparently at a single day resolution. Using Excel date time as the horizontal axis in a chart can give unexpected results. The plots used in this post use the unary value (number of rows of interest) for the horizontal axis, but the date time field is available per row for calculations.
Seconds - The elapsed time in seconds between the current tabulation report and the previous tabulation report (calculated).
Minutes - The elapsed time in minutes between the current tabulation report and the previous tabulation report (calculated).
Votes / Second Rate - The votes per second of the current tabulation report using the Seconds field (calculated). Of course, we cannot know when any given tranche of votes began to be counted. But it’s clear that the aggregation of vote tranches over the tabulation reports for almost all states looks like a bell curve (unless the initial count is absentee / mail in ballots that have been pre-counted). Various start times and reports times appear to blend together well in most groups of state tabulations. The sudden appearance of a spike in this field may be significant.
Trump Votes / Second - The portion of Votes / Second rate attributable to Trump (calculated) - Not currently used.
Biden Votes / Second - The portion of Votes / Second rate attributable to Biden (calculated) - Not currently used.
Trump Delta - The difference between the current tabulation Trump votes and the previous tabulation Trump votes (calculated).
Biden Delta - The difference between the current tabulation Biden votes and the previous tabulation Biden voted (calculated).
Trump / Biden Ratio percent - The ratio between the current tabulation Trump votes over the Biden votes expressed as a percentage (calculated).
Biden / Trump Ratio percent - The ratio between the current tabulation Biden votes over the Trump votes expressed as a percentage (calculated).
Trump incremental increase percent per tabulation report - the current difference between the current tabulation report and the total Trump vote as of the previous tabulation report expressed as a percent (calculated). This number should begin as a relatively large percent and reduce incrementally as the total vote value significantly increases and the incremental addition of votes per tabulation decreases. Large percentage increases in this field after 50 percent or so of the vote has been tabulated are rare and could be very significant.
Biden incremental increase percent per tabulation report - the current difference between the current tabulation report and the total Biden vote as of the previous tabulation report expressed as a percent (calculated). This number should begin as a relatively large percent and reduce incrementally as the total vote value significantly increases and the incremental addition of votes per tabulation decreases. Large percentage increases in this field after 50 percent or so of the vote has been tabulated are rare and could be very significant.
